

Crypto-assets like Bitcoin and Ethereum use decentralized blockchains to create an immutable record of transactions. This historical record of transactions is then freely available for anyone to analyze.
Blockchain analytics, otherwise known as on-chain analysis, refers to the application of data science and machine learning to extract insights from this transactional data.
In this guide, we'll discuss exactly what blockchain analytics is and 14 key terms any on-chain analyst, trader, or investor should be aware of.
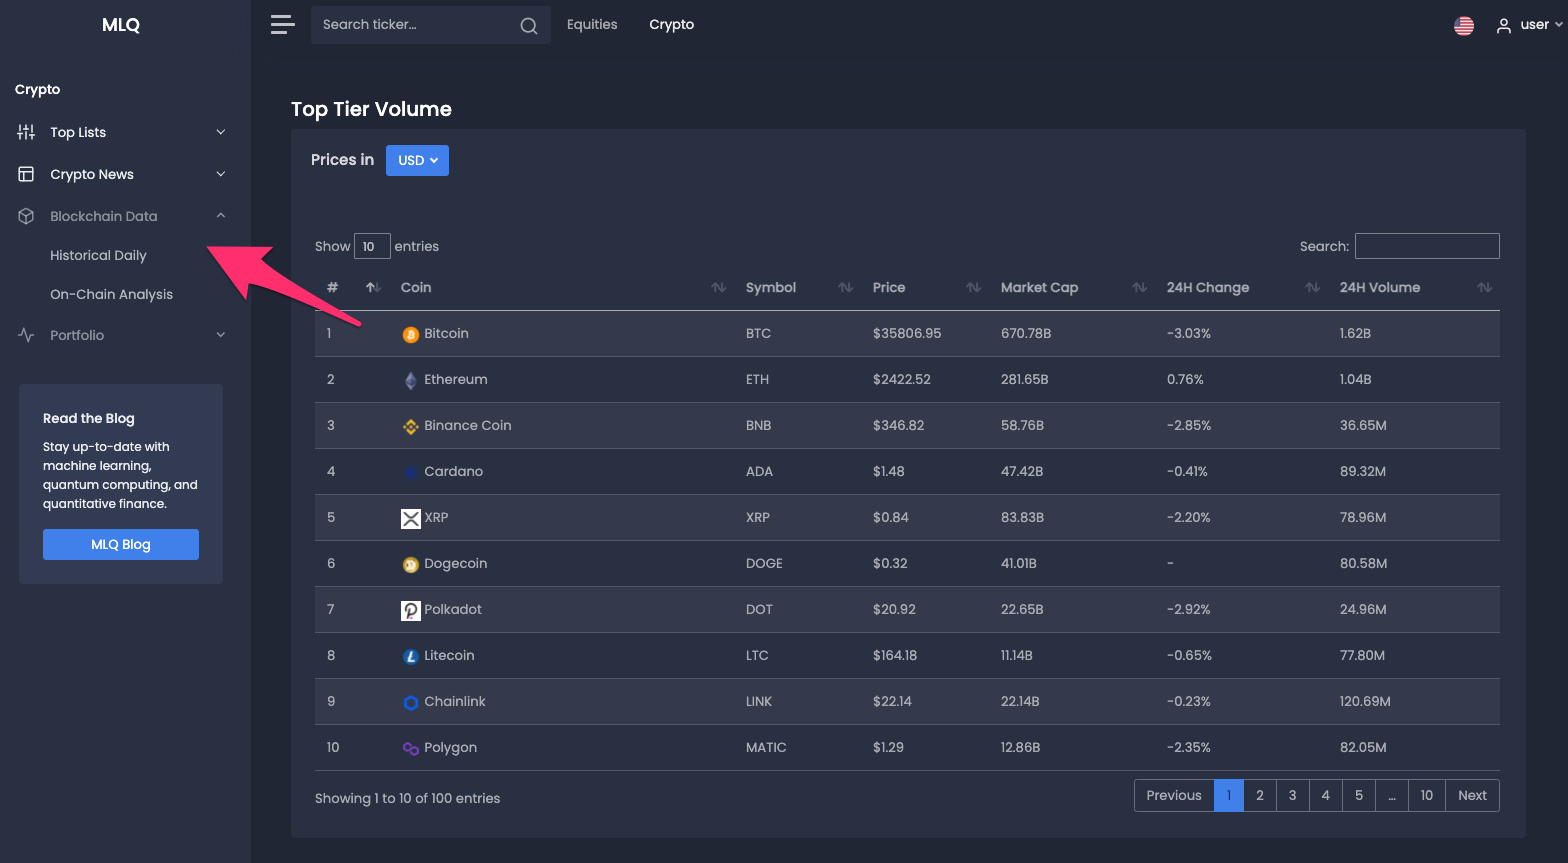
All of the data below can be found in the crypto section of the MLQ app, which is our AI investment research platform.
The platform combines fundamentals, alternative data, and machine learning-based insights for both crypto and equtities.
You can learn more about the MLQ app here or sign up for a free account here.
What is Blockchain Analytics?
The fact that blockchain transaction data is publicly available to anyone makes it well suited for data science and machine learning.
Also known as on-chain analysis, blockchain analytics is an emerging field that involves analyzing transactions and other blockchain data related to a network's activity in order to assess its fundamentals, sentiment, and overall utility.
Through analyzing blockchain data, on-chain analysts are able to gain insights into what other participants in the network are doing through data such as:
- Large transaction activity
- New network growth
- Exchange inflows and outflows
- Mining activity
- and more
As discussed in our guide to on-chain analysis:
Similar to how fundamental analysis of equities aims to understand the true value of a company, on-chain analysis uses publicly available blockchain data to value a network.
Crypto traders and investors often use on-chain analysis combined with technical analysis to determine trading signals for crypto assets.
In short, blockchain analytics refers to the process of analyzing publicly available on-chain data to assess the fundamental value of a network.
Blockchain Data for Predictive Analytics
Although on-chain analytics is still an emerging field, transactional data of other payment methods such as credit cards have been used for predictive analytics for decades.
A key difference between public blockchains is that transactional data contains no personally identifiable information of the sender and receiver. This information is instead represented cryptographically in the form of blocks.
In the case of Bitcoin, the SHA256 hash function provides the ability to hash a string of transactional data into a unique identifier for each and every transaction. As this article on blockchain analytics writes:
This implies that it is conceivable to get data for each and every transaction ever made on Bitcoin, which is basically every data scientist’s dream.
Stay up to date with AI
14 Key Blockchain Analytics Terms
Now that we've discussed what blockchain analytics is, let's look at 15 key terms that every data scientist, trader, and investor should be aware of. All of this data can be found in the Historical Daily section of the MLQ app.
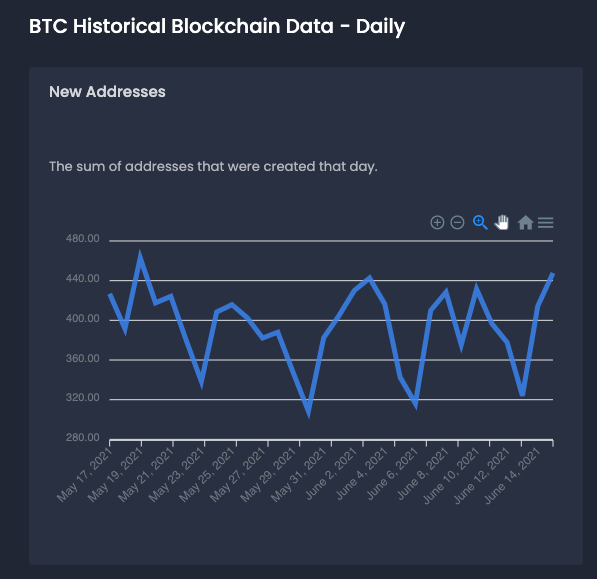
New Addresses
New addresses refer to the sum of addresses that were created that day.
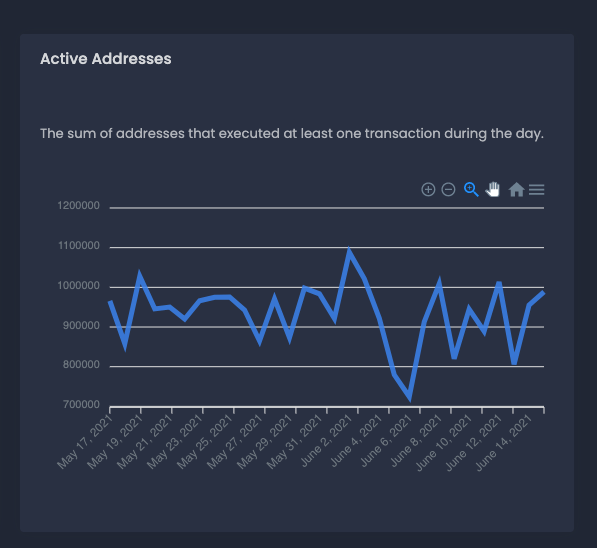
Active Addresses
Active addresses refer to the sum of addresses that executed at least one transaction during the day.
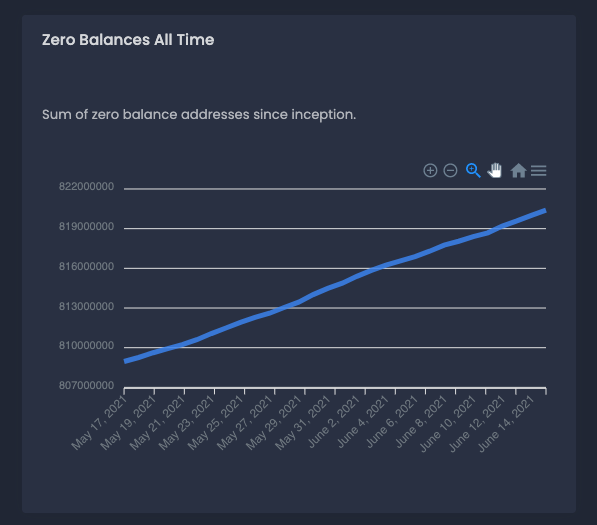
Zero Balances All Time
Zero balances all-time refers to the sum of zero balance addresses since inception.
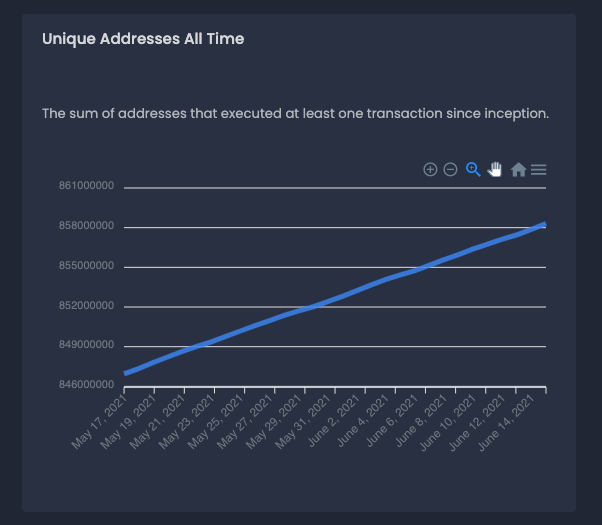
Unique Addresses All Time
This metric refers to the sum of addresses that executed at least one transaction since inception.
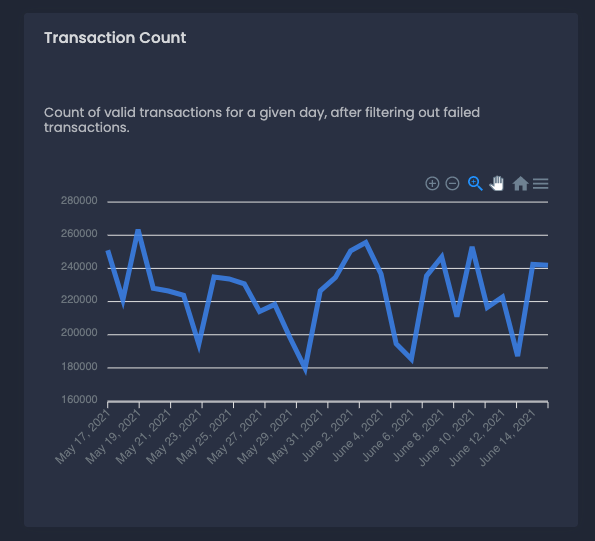
Transaction Count
Transaction count refers to the count of valid transactions for a given day, after filtering out failed transactions.
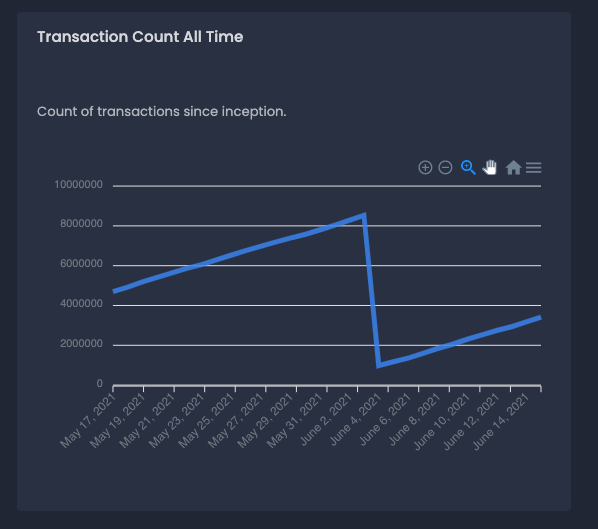
Transaction Count All Time
Transaction count all time refers to the count of transactions since inception.
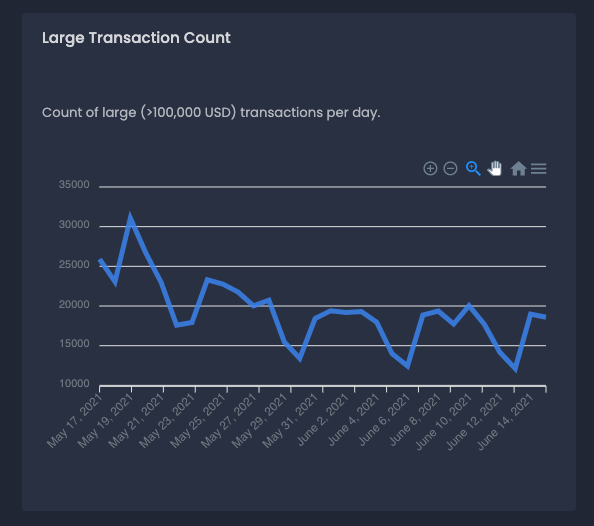
Large Transaction Count
Large transaction account refers to the number of large (>100,000 USD) transactions per day.
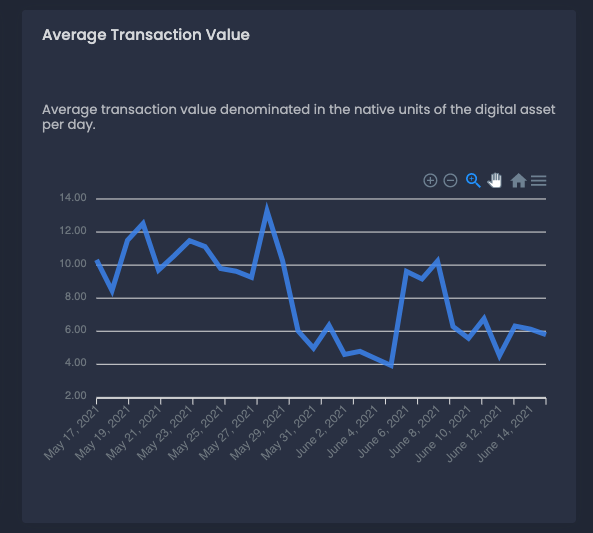
Average Transaction Value
Average transaction value is the value denominated in the native units of the digital asset per day. As you can see below, in the case of bitcoin this number is fluctuating between 4 and 14 bitcoin per day.
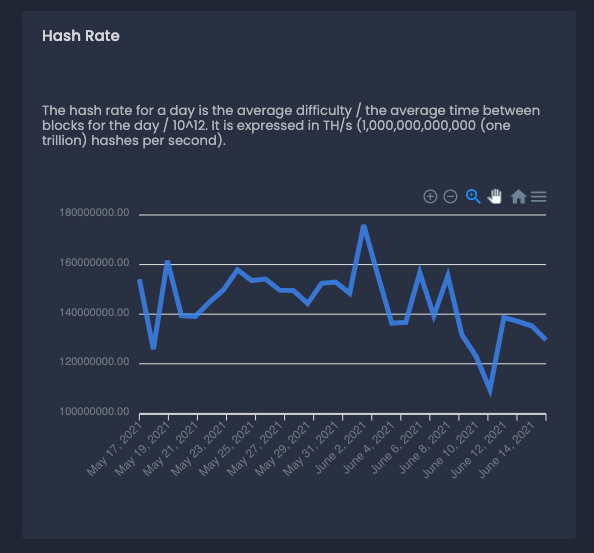
Hash Rate
The hash rate for a day is the average difficulty / the average time between blocks for the day / $10^{12}$. It is expressed in TH/s (1,000,000,000,000 (one trillion hashes per second).
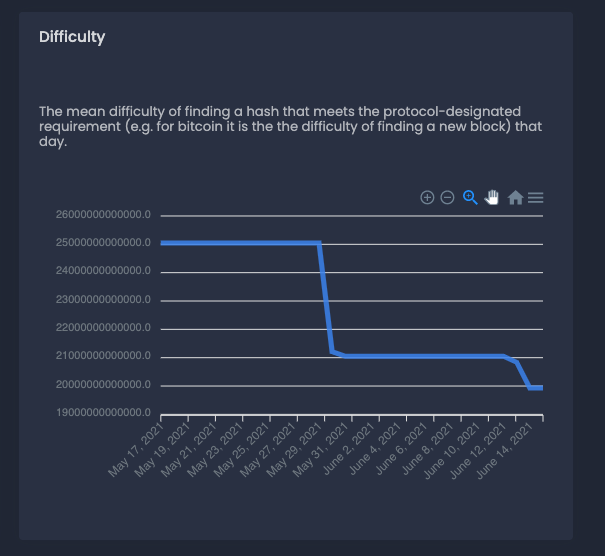
Difficulty
Difficult is the mean difficulty of finding a hash that meets the protocol-designated requirement (e.g. for bitcoin it is the difficulty of finding a new block) that day.
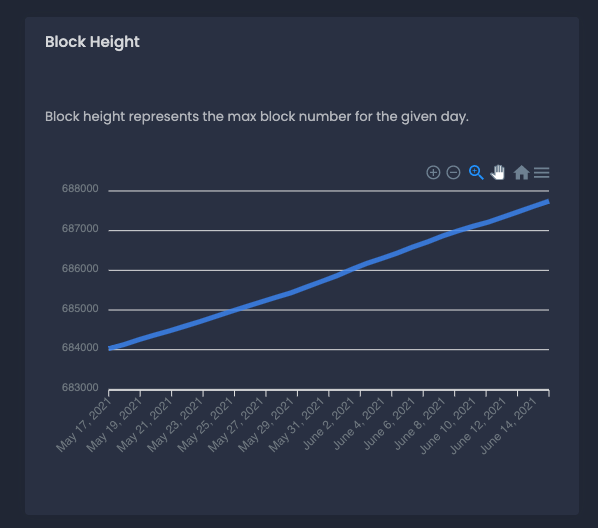
Block Height
Block height represents the max block number for the given day.
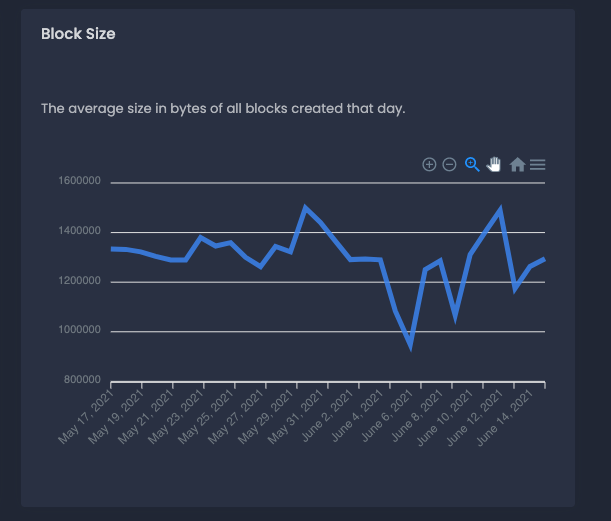
Block Size
Block size is the average size in bytes of all blocks created that day.
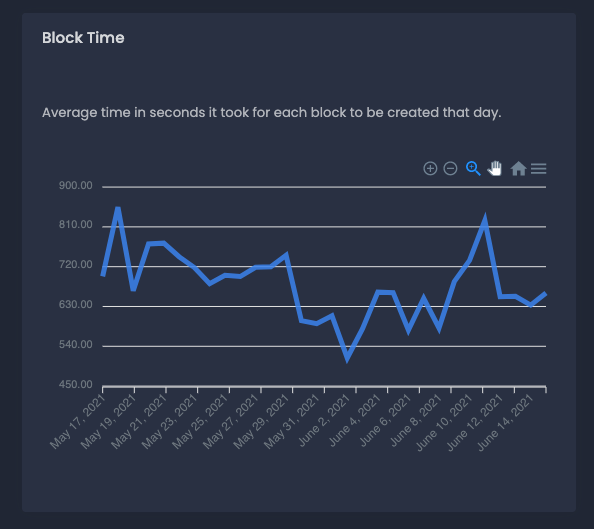
Block Time
Block time is the average time in seconds it took for each block to be created that day.
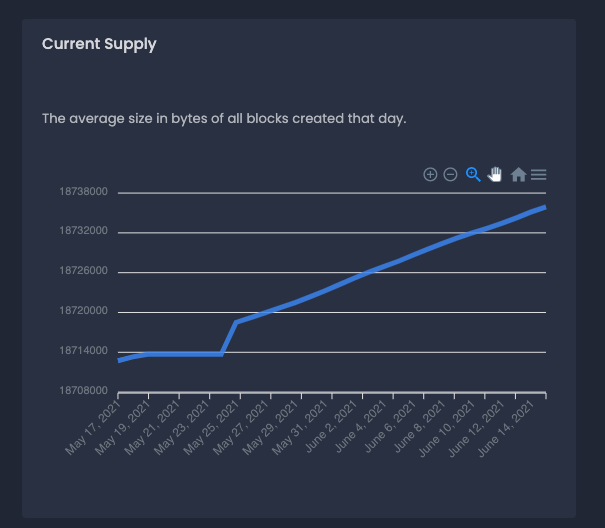
Current Supply
Current supply refers to the average size in bytes of all blocks created that day
Summary: Blockchain Analytics
While historical blockchain data can certainly provide insights into the growthand utility of a network, it does take some experience to understand the importance of each metric.
To solve this, in the on-chain analysis section of the MLQ app these metrics are analyzed using data science machine learning and summarized in trading signals. As you can see below, the top of the page provides a Token Summary with the following data:
- Holders making money at the current price
- Concentration of large holders
- Price correlation with bitcoin
- Transactions greater than $100k
- Transaction demographics (West vs. East)
- Total exchange inflows and outflows
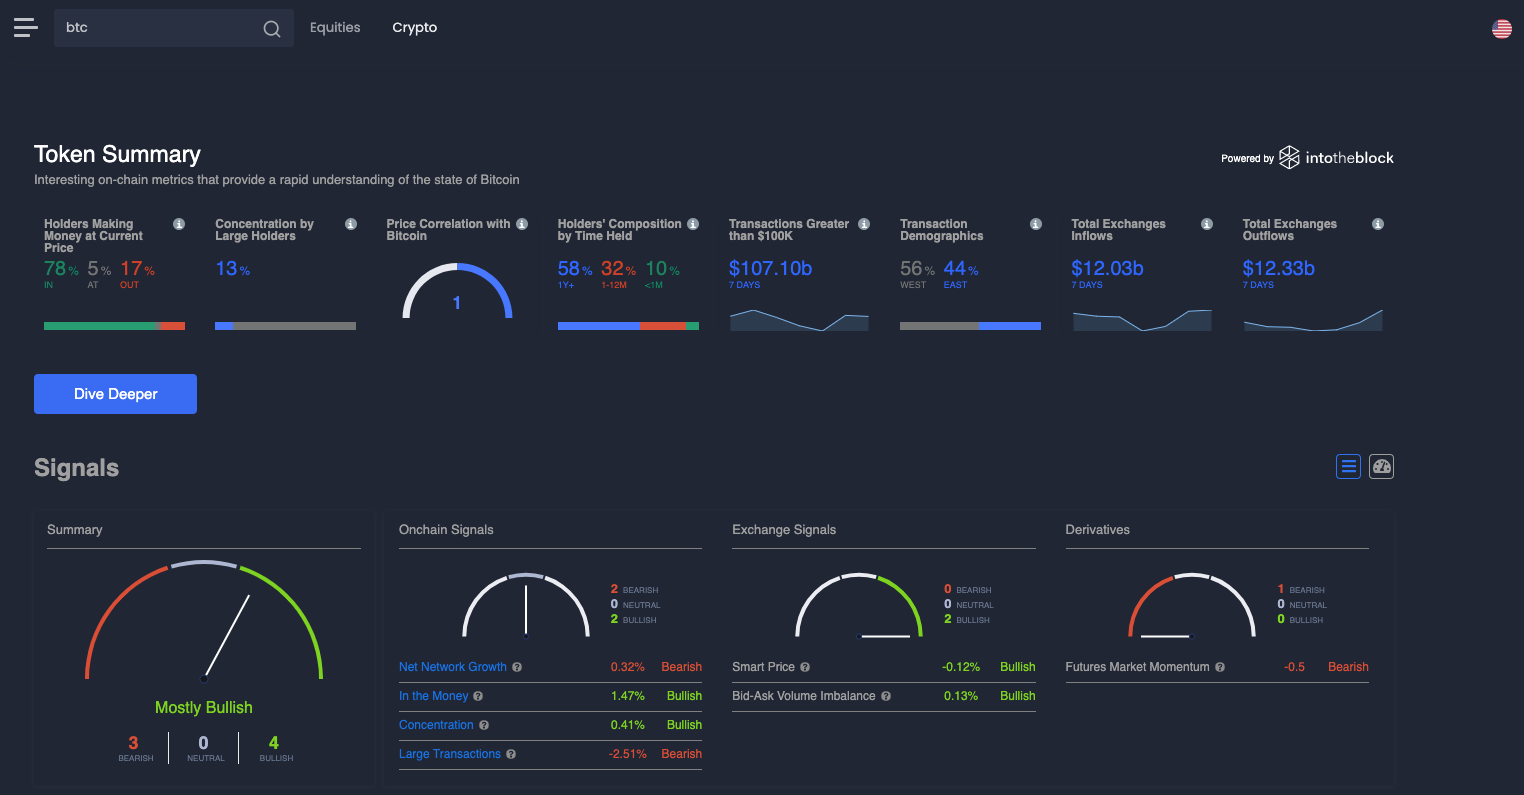
Below the Token Summary section, these on-chain metrics are analyzed and distilled into trading signals. Specifically, the signals are summarized into bullish and bearish sentiment scores in three main categories :
- On-chain signals
- Exchange signals
- Derivative signals
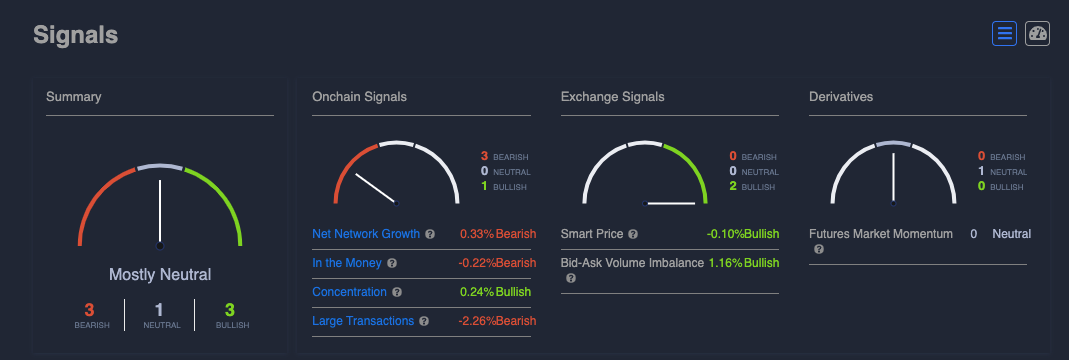
As discussed in our guide to on-chain analytics:
Each of these signals are based on the underlying indicators provided by IntoTheBlock, although the trading signals represent momentum signals based on relative changes of the indicator.
If you want to learn more about blockchain analytics and crypto on-chain analysis, you can create a free account for the MLQ app here.


