

One of the most interesting applications of AI and machine learning for trading and investing is in ranking stocks, otherwise known as predictive equity ranking.
In using AI and machine learning to rank stocks, this allows traders and investors to take a "quantamental" approach. As discussed in our guide to quantamental investing:
Quantamental investing has become an increasingly popular approach to investment management and seeks to increase risk-adjusted return by combining the scientific rigor of quantitative analysis with the more discretionary, fundamental analysis of assets.
In other words, quantamental investing is all about combining the analytical and predictive power of artificial intelligence with human experience and insights.
In this guide, we'll look at several ways that investors can use AI and machine learning to rank stocks to improve their investment research process, including:
- What is Predictive Equity Ranking?
- Examples of Equity Ranking Scores
- How to Use Rankings for Investment Research & Portfolio Optimization
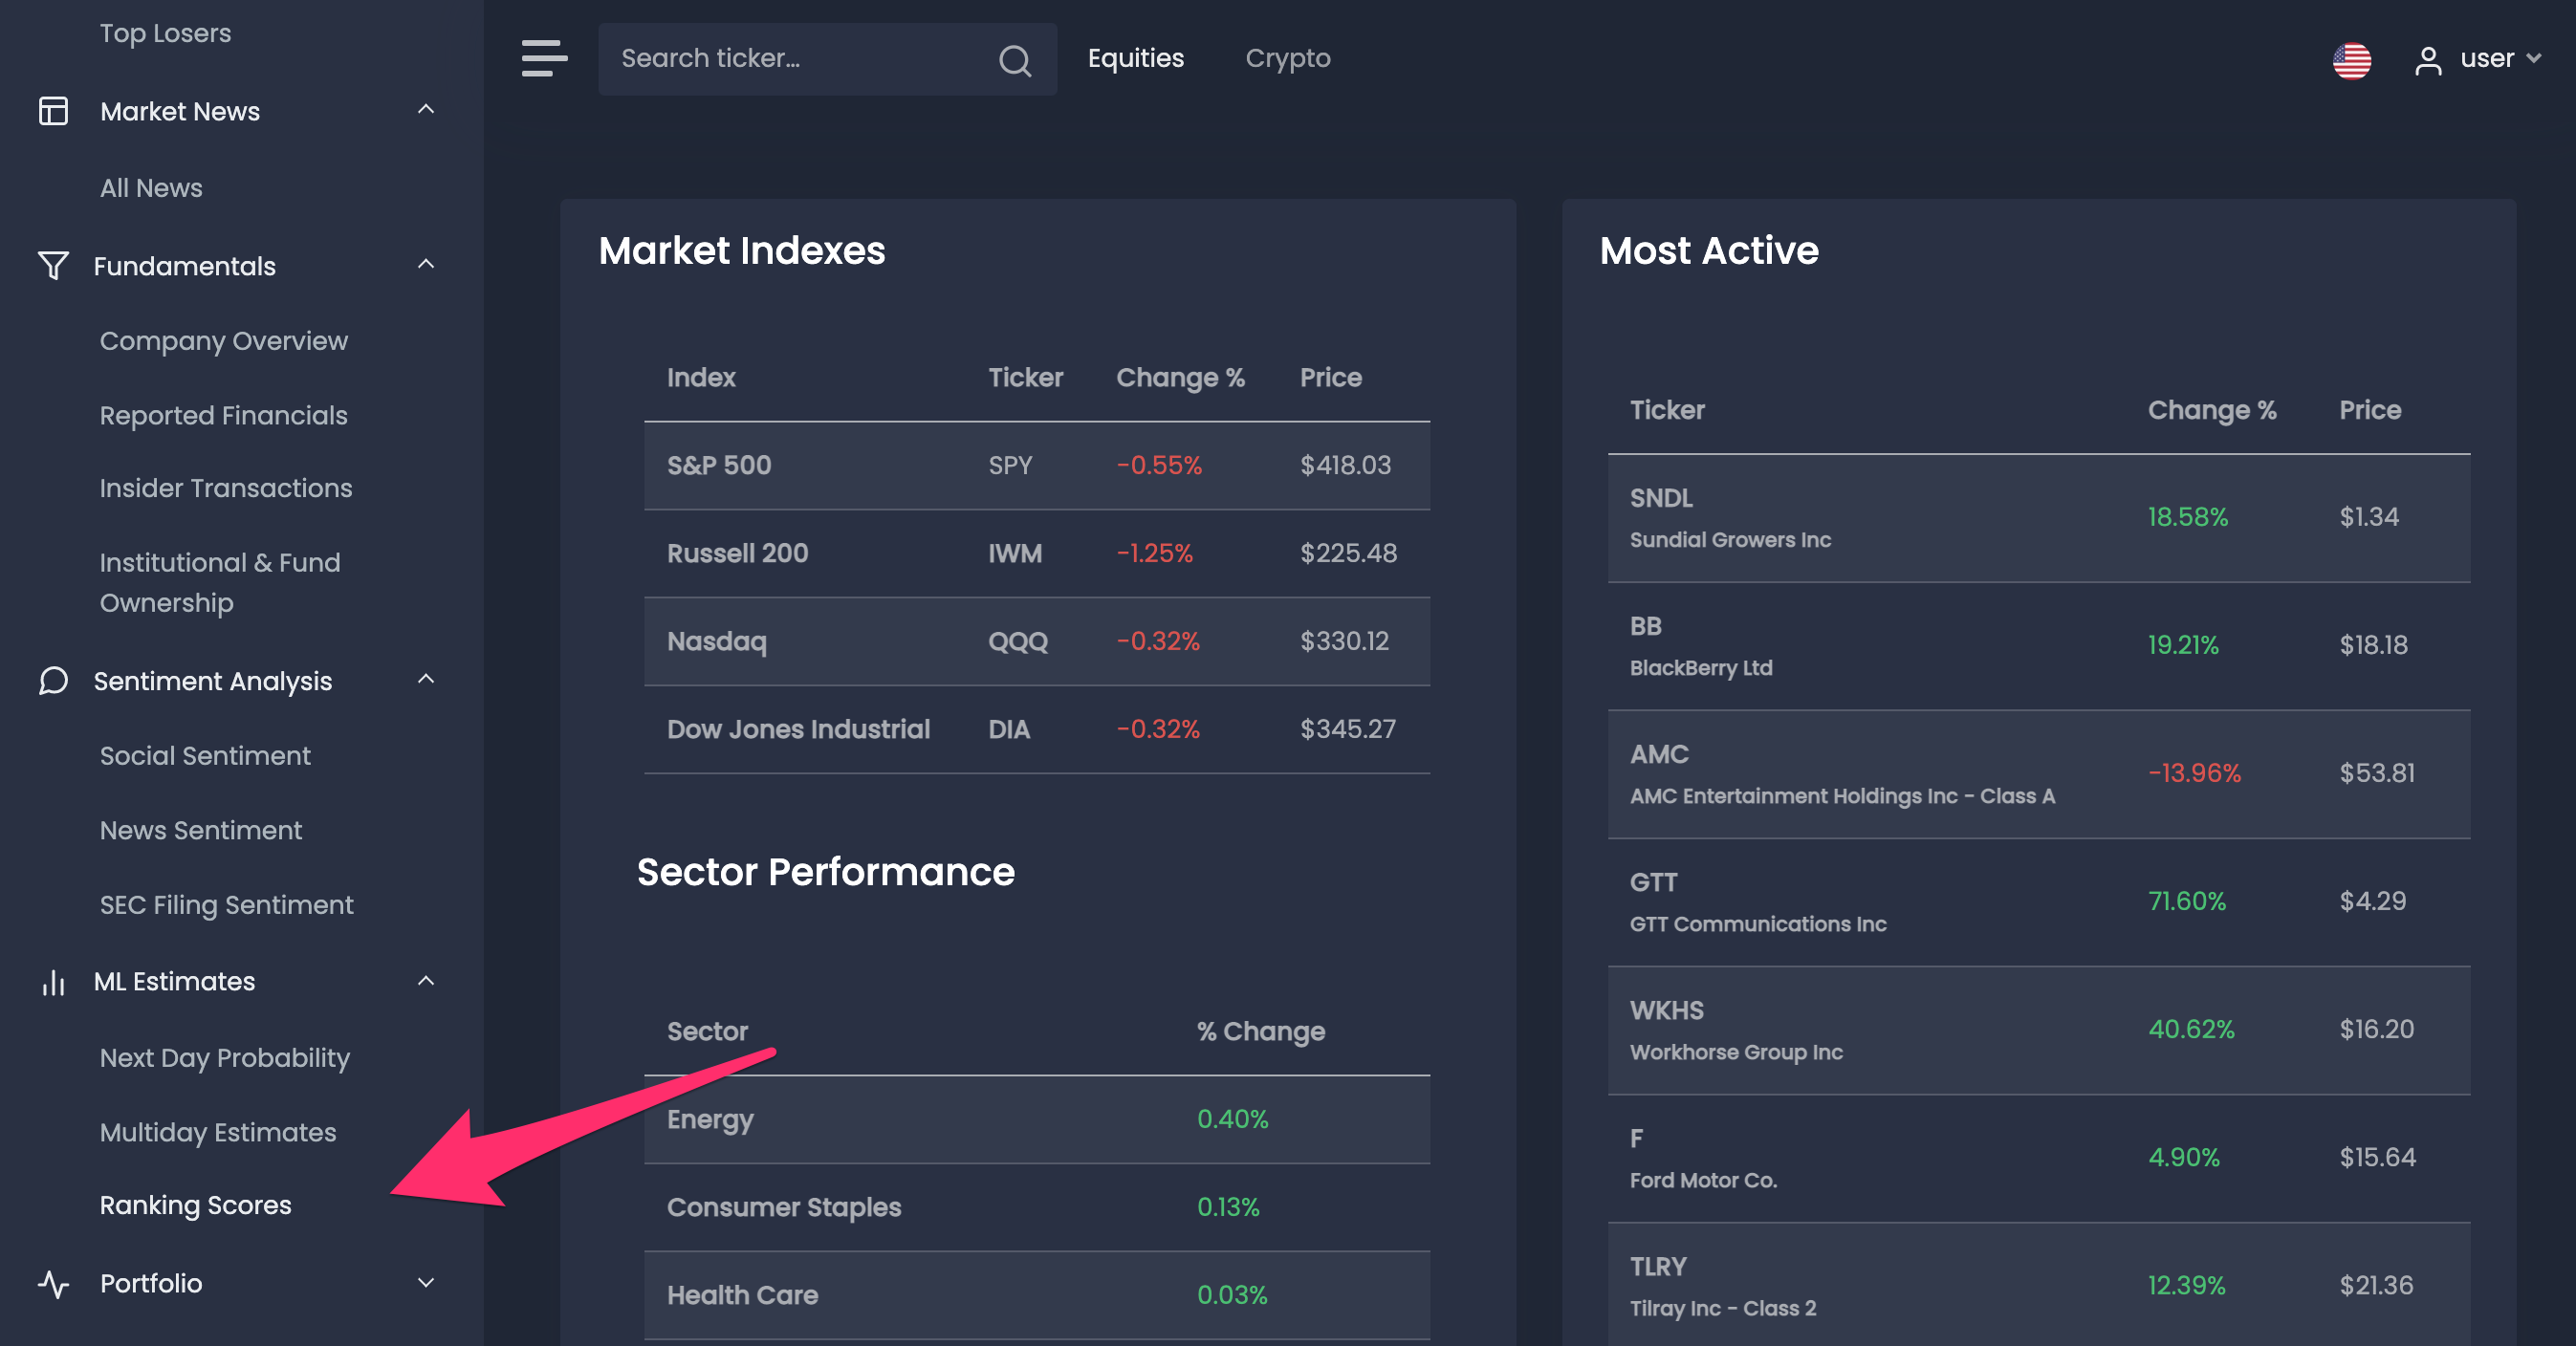
Each of the predictive equity rankings we'll look at can be found in the MLQ app, which is an AI-powered investment research platform that combines fundamentals, alternative data, and ML-based insights.
You can learn more about the platform here or sign up for a free account here.
Disclaimer: The views and opinions expressed by the author are for informational purposes only and do not constitute financial, investment, or other advice.
What is Predictive Equity Ranking?
Predictive equity ranking refers to the process of generating stock rankings based on a variety of input data, trading signals, and machine learning algorithms.
The data provider Kavout has pioneered the field of predictive equity ranking with their research that seeks to find alpha from factors, anomalies, and signals. As described on their website:
Enhanced by AI and machine learning technologies, Kavout delivers risk-adjusted alpha signals as data feed and portfolio design to equity buy-side firms.
In order to produce these equity rankings, the company takes in a diverse set of datasets ranging from pricing, fundamentals, and alternative data. In particular, the company considers over 200 factors and signals to produce equity rankings, including but not limited to:
- Factor models such as value, growth, momentum, and more
- Financial reports such as revenue, EBITDA, net income, and more
- Technical indicators such as RSI, MACD, and more
- Time series of price and volume related data
- Alternative data such as insider and options trading
- Sentiment analysis of text data
With these data inputs, they use a combination of machine learning techniques, statistical analysis, and ranking algorithms to derive a simple equity ranking ranging from 1 to 9.
By gathering and processing such a large and diverse set of data, these equity rankings allow investors to identify unique patterns and relationships in the markets for the purpose of predictive analytics.
In addition, the ML-based algorithms are constantly processing new data and improving their predictive ability through a dynamic learning technique called reinforcement learning.
In short, these predictive equity rankings allow traders and investors to take advantage of the advances in AI and machine learning without having to build models themselves.
As the company highlights on their site, generating actionably predictive equity ranking involves three core techniques or the "3Ds of machine learning":
- Deep data: With so much data across multiple sources available to investors, the first step is to remove data silos and produce greater correlation value.
- Deep learning: The next step involves processing complex data and discovering non-linear relationships that may have otherwise gone unnoticed with more traditional techniques like statistical modeling.
- Deep discovery: The use of AI and machine learning enables investors to uncover relationships, trading signals, trend predictions, and other unique insights to increase alpha.
Now that we've discussed how predictive equity ranking works, let's look at each of the equity ranking scores provided in the MLQ app.
Stay up to date with AI
Examples of Equity Ranking Scores
As mentioned, Kavout takes in over 200 factors and uses an ensemble machine learning technique, which refers to using multiple learning algorithms to increase the predictive performance of each stock ranking.
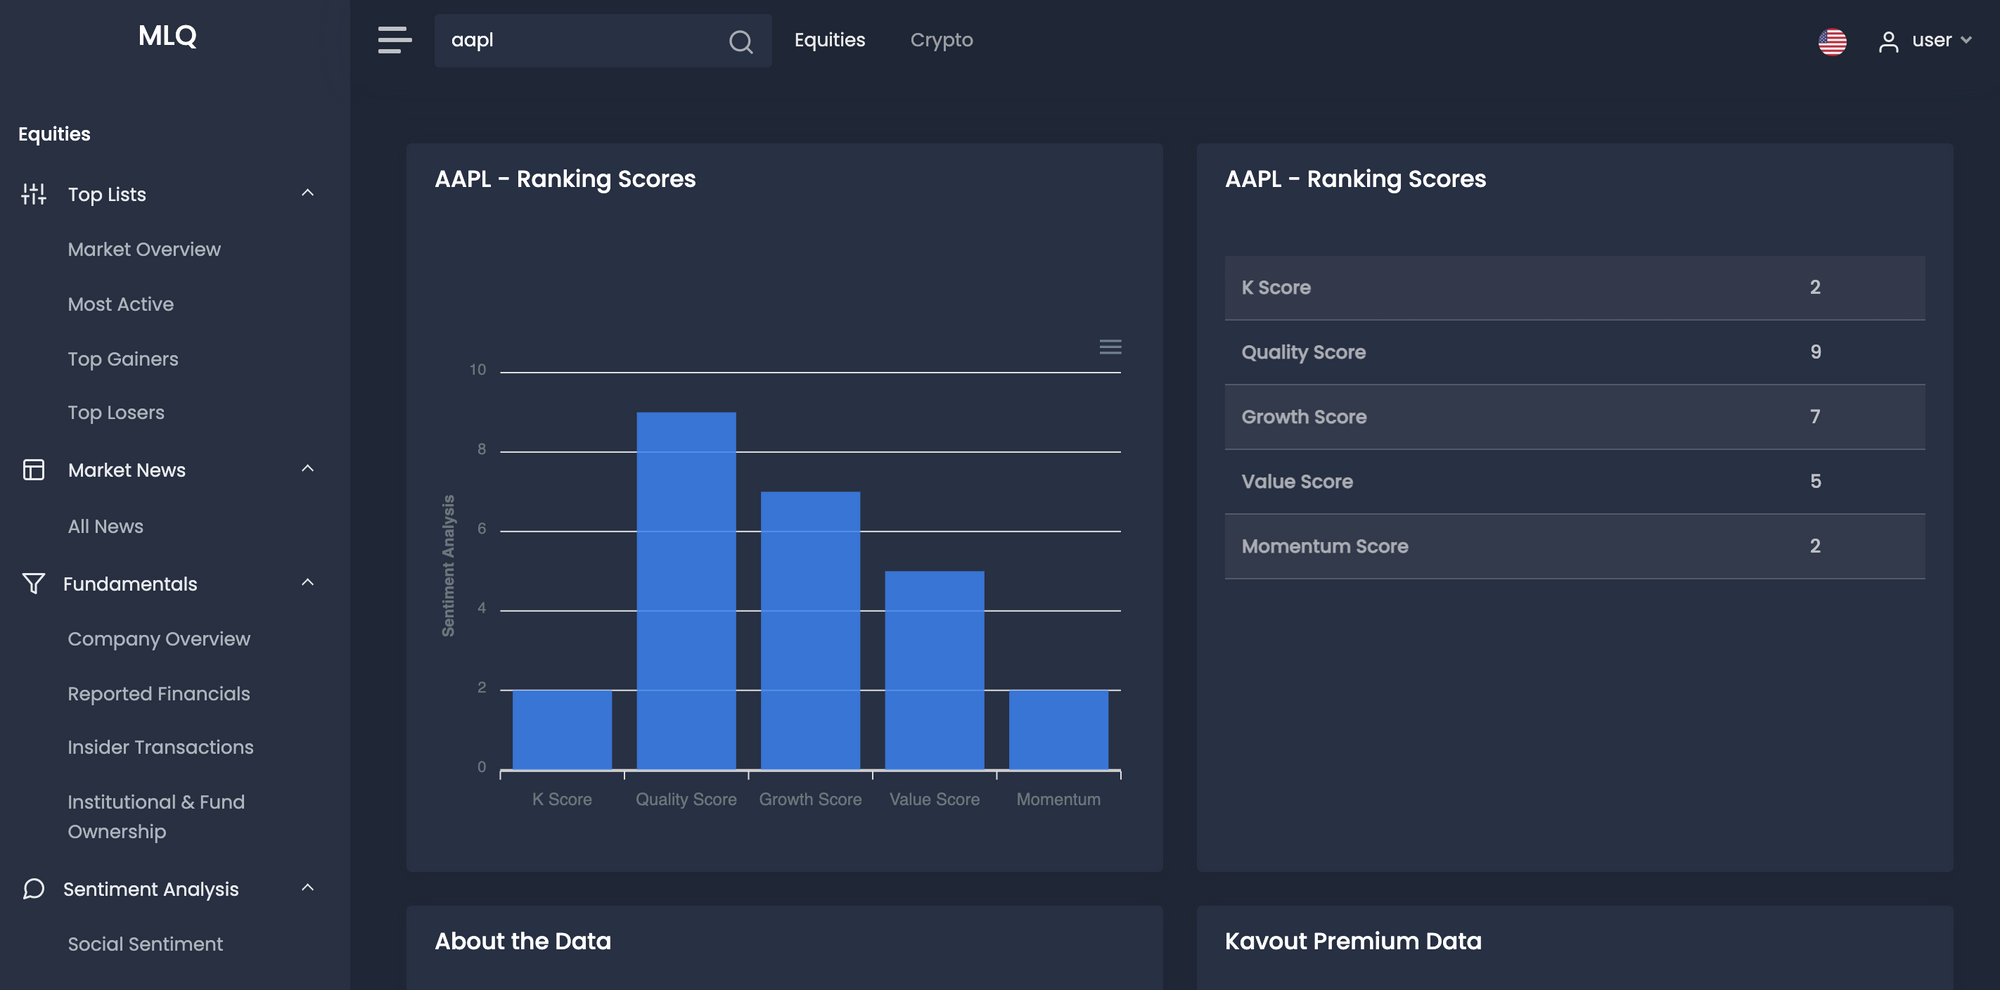
Inside the MLQ app, you'll find the following equity rankings for around 4000 US equities:
- K Score
- Momentum
- Value
- Growth
- Quality
K Score
Kavout's first stock ranking is called the K Score, which they describe as:
A derived equity rating score between 0 and 9 with high K Scores indicating higher probability of out-performance over the next month.
In order to produce a K Score for equities, the company processes millions of data points ranging from traditional financial metrics as well as more advanced financial engineering techniques such as deep learning, reinforcement learning, and more.
The K Score is a perfect example of a quantamental investing strategy as it pairs fundamental research with a data-driven approach to quantitative analysis.
In addition to using this score as part of a fundamental research process, K Scores can also be used as signals that are overlaid in systematic or quantitative trading models.
Momentum Score
Next up, the momentum score measures the rate at which a company's price or volume is accelerating.
The goal of the momentum score is to rank stocks based on how well they're capitalizing on existing market trends. Based on this data, investors may go long stocks that are demonstrating upward-trending momentum and short prices taht are trending downwards.
The factors that go into calculating the momentum score include, but are not limited to:
- Relative strength index (RSI)
- 52-week high/low
- Earnings momentum
Value Score
The next equity ranking in the MLQ app is a value score, which indicates whether a stock is overpriced or underpriced at current levels. Factors that go into calculating the value score include but are not limited to:
- Earnings yield
- Price-to-book (P/B)
- Enterprise Value to EBITDA
- Price to sales
As Kavout states on their site in regards to the value score:
While no single value metric is able to fully explain the long-term risk and return performance of equities, we aim to capture the return of factors which have demonstrated excess historical market returns.
Growth Score
The Growth Score is indicative of a company's growth and related growth factors. These factors include but are not limited to:
- ROA/ROE
- 3 year growth rate
- Sustainable earnings
Quality Score
Finally, the Quality Score is indicative of how well-managed a company is how strong the financial health of the company is. Factors that go into the calculation include but are not limited to:
- Working capital to long-term debt ratio
- Greenblatt ROC
- Dividend payout
- Operating profitability
How to Use Rankings for Investment Research & Portfolio Optimization
Let's now discuss how these predictive ranking scores can be used in a variety of investment workflows including fundamental research, portfolio construction, risk mitigation, and improving quantitative models.
In terms of fundamental investment research, analysts can use these equity rankings in order to efficiently screen stocks and identify new opportunities that may not have been on their radar before.
In the process of portfolio construction and optimization, investors can also use the K Score for risk mitigation by avoiding equities with low scores (1 to 3). Similarly, investors may choose to allocate a portion of their portfolio to stocks with a higher K Score (7 to 9), as this indicates a higher probability of outperformance over the next month.
Finally, for quantitative investors, these predictive equity rankings can be used as an input to their models in order to improve buy/sell recommendations and portfolio weightings.
Summary: Machine Learning for Ranking Stocks
In summary, one of the main applications of AI and machine learning in finance is ranking stocks, or predictive equity ranking.
In this case, the stock rankings inside the MLQ app come from a data provider that takes in over 200 factors and trading signals including pricing, fundamentals, technicals, and alternative data. This data is then fed into an ensemble machine learning technique to produce predictive equity rankings.
By taking a data-driven approach to investing and using equity rankings, this allows traders and investors to take advantage of the analytical power of artificial intelligence while still using their own discretionary research and experience.
As this approach of quantamental investing is becoming increasingly popular amongst professional traders and investors, we built the MLQ app—which is an investment research platform that combines fundamentals, alternative data, and AI-based insights.
You can learn more about the platform here or sign up for a free account here.


