

With an estimated 1.14 trillion MB of data generated every single day, the amount of alternative data available to quantitative analysts and investors is staggering.
From social sentiment, web scraping, credit card transactions, satellite imagery, geolocation, NLP—there's no shortage of alt-data available to uncover insights, trends, and forecasts.
Over the past decade, financial firms and investment managers have been increasingly taking advantage of this alternative data in search of alpha-generating ideas. As individual investors and investment managers continue to search for alpha in financial markets, the rise of alternative data has also created a need for data science and machine learning to make sense of the big, often unstructured data.
In fact, as a Grennich Associates study highlights:
72% of investment firms reported that alternative data enhanced their signal, with over a fifth of respondents saying they got over 20% of their alpha — industry lingo for the ability to beat the market — from alternative data.
While much of this data was previously only available to hedge funds and institutional asset managers, in recent years there has been a similar rise in the availability and access to alternative data for investors of all sizes.
In this guide, we'll discuss exactly what alternative data is, examples and challenges of alt-data, and how machine learning can be used to extract insights and actionable trading signals from the noise.
In particular, we'll discuss:
- What is Alternative Data?
- Examples and Use Cases of Alternative Data
- The Challenges of Alternative Data
- Applying Machine Learning to Alternative Data
- Case Study: The Value of Alternative Data for Investors
Stay up to date with AI
What is Alternative Data?
Alternative data refers to any non-traditional data that is used to gain investment insights. In the context of equities, traditional data includes everything that comes from the company itself such as the c0mpany filings, fundamentals, or earnings calls. Alternative data, on the other hand, refers to datasets that are published or generated by sources other than the company in question.
The goal of using alternative data is to gain an edge as it may contain unique and undiscovered insights related to the company. As the alternative data aggregator Quandl writes, "alternative data is untapped alpha":
The biggest opportunity for investors in this decade comes from the signals buried in the data generated by the digital economy. Alternative data is the deepest, least utilized alpha source in the world today.
Examples and Use Cases of Alternative Data
A few of the most common and early sources of alternative data include:
- Credit card transactions
- Data scraped from the internet
- Mobile device data
- Geolocation data
- Sattelite imagery
- Weather forecasts
- IoT sensors
- ESG (environmental, social, and corporate governance) data
Some of these datasets have received more regulation with privacy concerns and GDPR, CCPA, which have led to a new wave of data sources and alternative data providers.
A few examples and use cases of alternative data sets include that Dataiku mentions in their whitepaper include:
Geospatial data
One company's geospatial data showed an increase in foot traffic that represented an increase in sales at Popeyes and Chick-fil-A restaurants the month after launching new products. This led to new insights about broader trends surrounding product launches, for example, supply chain capacity considerations.
Sattelite imagery
A technology company tracks global seaborne trade by tracking satellite signals from oil tankers. This data led the company to correctly predict a slowdown in global shipping, which they used to short oil futures.
Natural Language Processing (NLP)
One company used natural language processing (NLP) to analyze initial news transcripts from Hurricane Irene to verify certain numbers and understand the risk exposure of insurance companies.
As you can see from these examples, translating raw alternative data into trading and investment insight is equally if not more challenging than procuring the data itself. Luckily, with the help of machine learning to analyze big data, these insights can be summarized into more understandable and actionable metrics.
The Challenges of Alternative Data
There's no question that alternative data can complement traditional datasets by helping discover relationships and patterns in consumer or business trends. One of the more challenging parts, however, is translating these insights into trading signals.
With increased adoption of data science and machine learning, however, the adoption of alternative data continues to rise year-over-year. That said, there are several concerns that exist around alternative data that, including:
- Costs and difficulty of procurement
- Hiring technical talent to work with alternative data effectively
- Using the data to accurately assess financial risks and identify opportunities
To solve these challenges, the right technology and building a foundation for data science and machine learning within an organization can go a long way. As Dataiku puts it:
By using an inclusive, collaborative data science and machine learning platform, investors can bring more seats to the table to ensure the right people — from data scientists to quants to analysts — are working together across various projects in a way that enhances productivity and allows visibility to those who need it.
Now that we've discussed the rise of alternative data and associated challenges, let's look at how AI and machine learning can be used to extract insights from this data.
Applying Machine Learning to Alternative Data
Recent advances in AI and machine learning have led to a shift in the way analysts, data scientists, and investment managers make use of big data.
In particular, there has been a major shift towards "quantamental investing", which is described in our guide to quantamental investing as follows:
Quantamental investing enables asset managers to take advantage of the advances in data science and machine learning, while still making use of their own discretion, knowledge, and expertise of markets.
While many of the largest quantitative hedge funds have been using machine learning in their algorithmic trading for years, these recent advances have opened the door for investors of all sizes to incorporate the technology in their investment research process.
Below are several examples of the alternative data and machine learning-based insights provided in the MLQ app, our AI investment research platform.
Sentiment Analysis & NLP
Sentiment analysis and natural language processing (NLP) is one of the most common and useful applications of machine learning for finance. With the massive amount of text data available on equities, NLP allows investors to efficiently analyze this data and gain insights into the entire corpus of data.
Three main uses cases for sentiment analysis in trading and investing include:
- Social sentiment
- News sentiment
- SEC filings sentiment
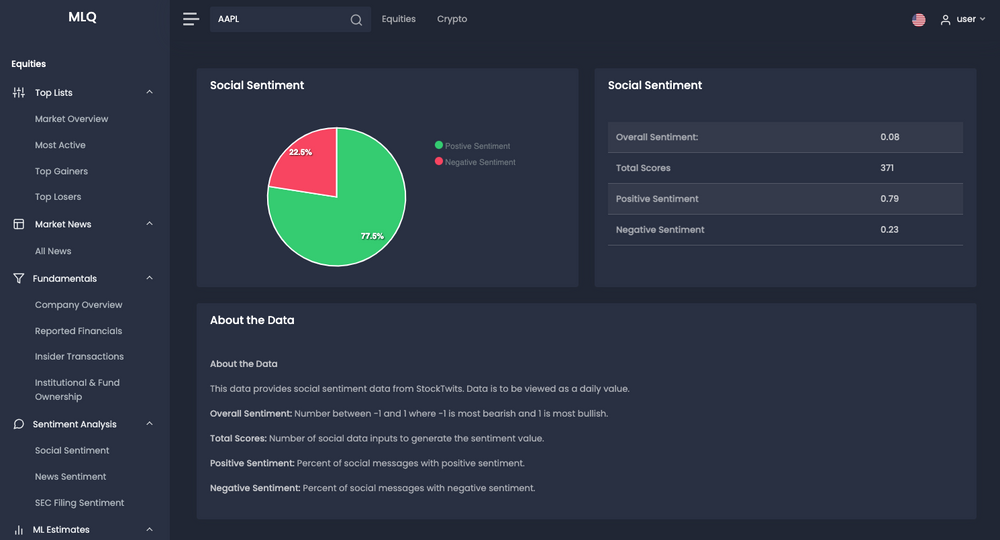
Social Sentiment
Social sentiment can provide insights into what th0usands of investors are saying about a company at any given time. In the MLQ app, social sentiment scores are sourced from StockTwits and include the positive sentiment, negative sentiment, and an overall score for each ticker:
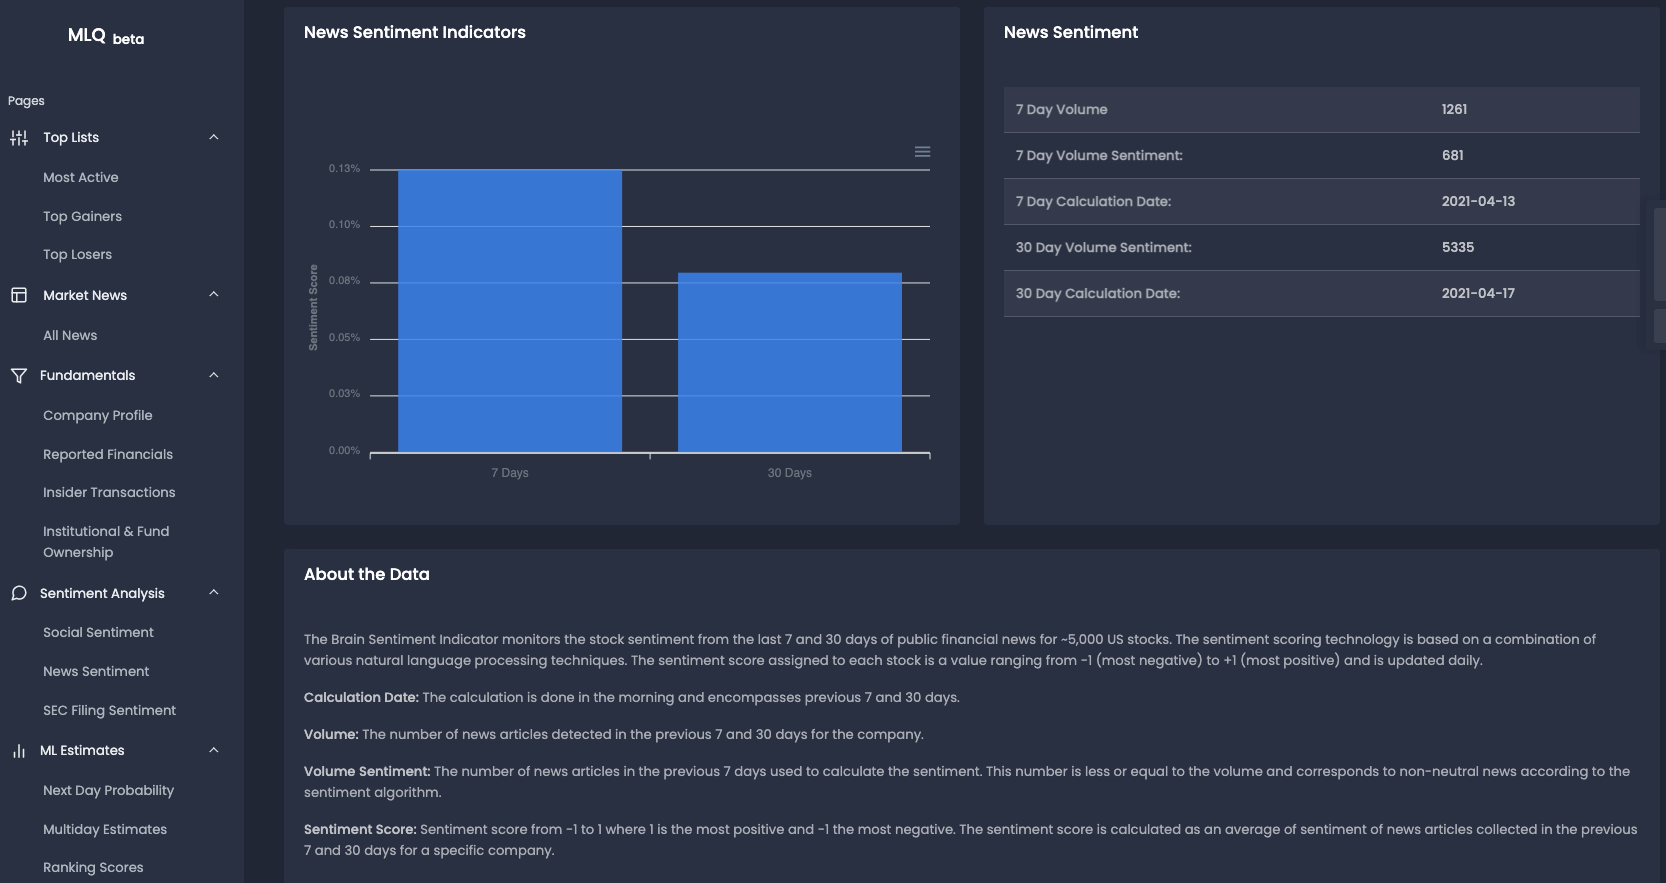
News Sentiment
Financial news is another example of text data that can be time-consuming and inefficient to read everything and accurately gauge the overall sentiment. To solve this, the MLQ app provides news sentiment scores for the last 7 and 30 days for around 5000 US stocks:
SEC Filing Sentiment
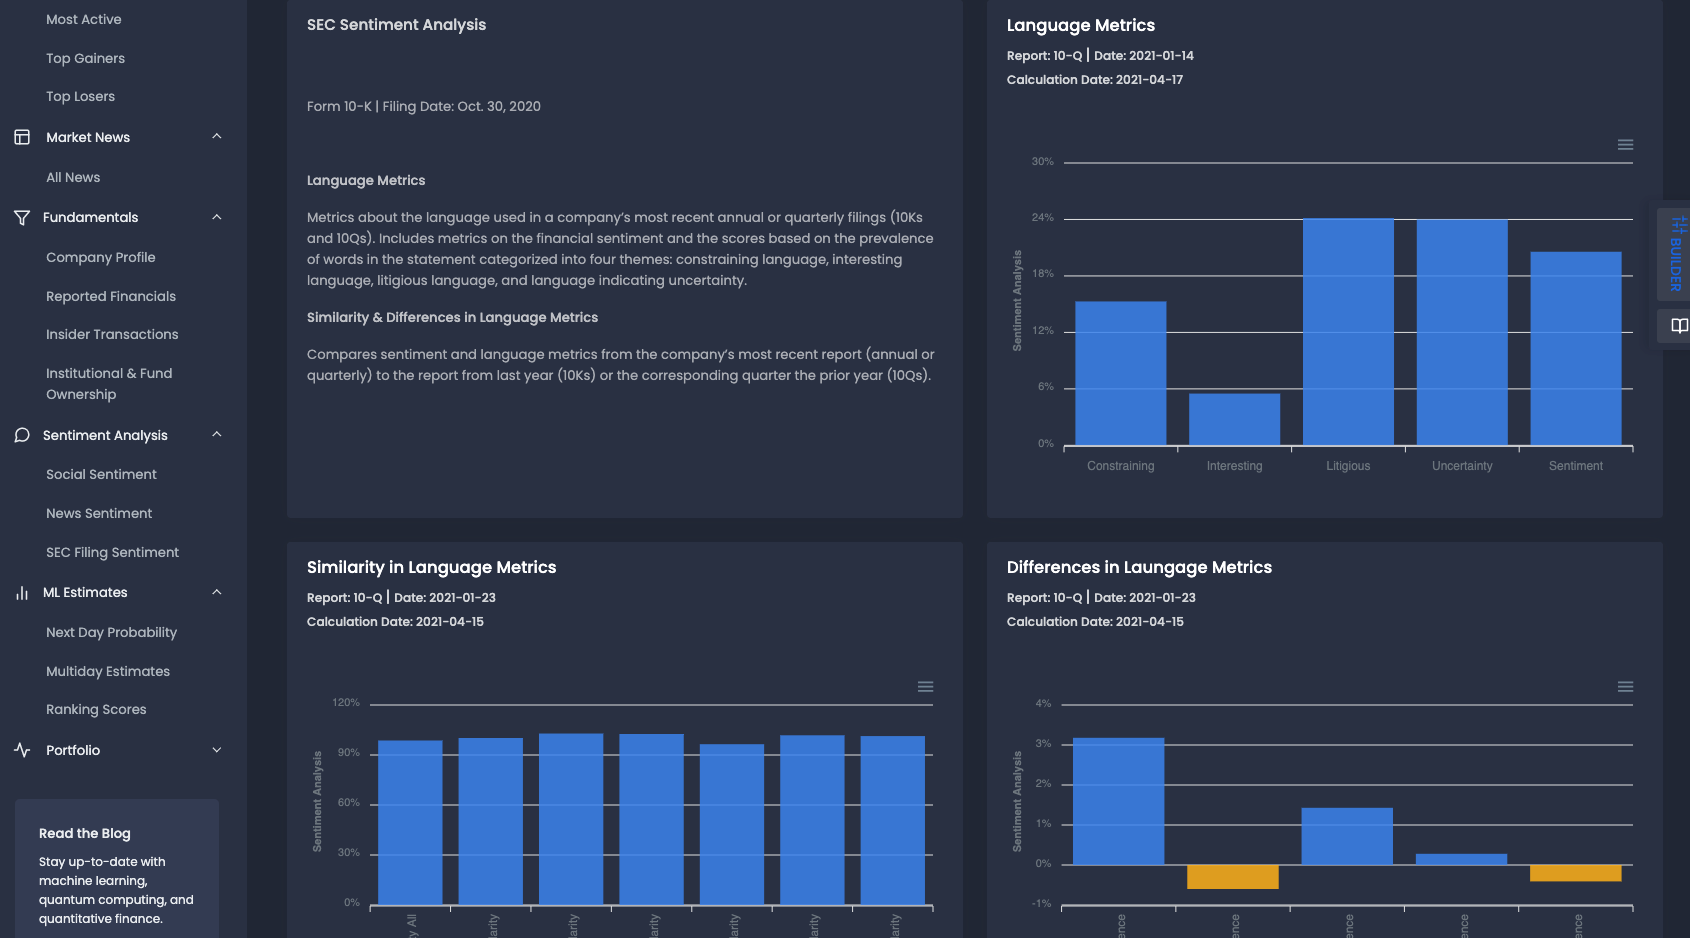
Finally, SEC filings contain a wealth of valuable text-based information that is well-suited for natural language processing. As an analyst, you can speed up your investment research by first reviewing the language metrics of the filings you're interested in. This would allow you to efficiently determine if there is important information in the filing, for example, litigious language, that would warrant investigation.
In the MLQ app, there are language metrics for a company's most recent SEC filing, including:
- Constraining
- Interesting
- Litigious
- Uncertainty
- Overall sentiment
Below that we also have the similarity and differences in language metrics from the previous filing:
Predictive Equity Ranking
Another application of machine learning for alternative data is ranking stocks based on a variety of factors, otherwise known as predictive equity ranking.
In order to produce these equity rankings, one of MLQ's data providers Kavout takes over 200 factors from both traditional and alternative data sources, including:
- Factor models such as value, growth, and momentum
- Financial reports such as revenue, EBITDA, net income, and more
- Technical indicators such as RSI, MACD, and more
- Time series of price and volume related data
- Alternative data such as insider and options trading
- Sentiment analysis of text data
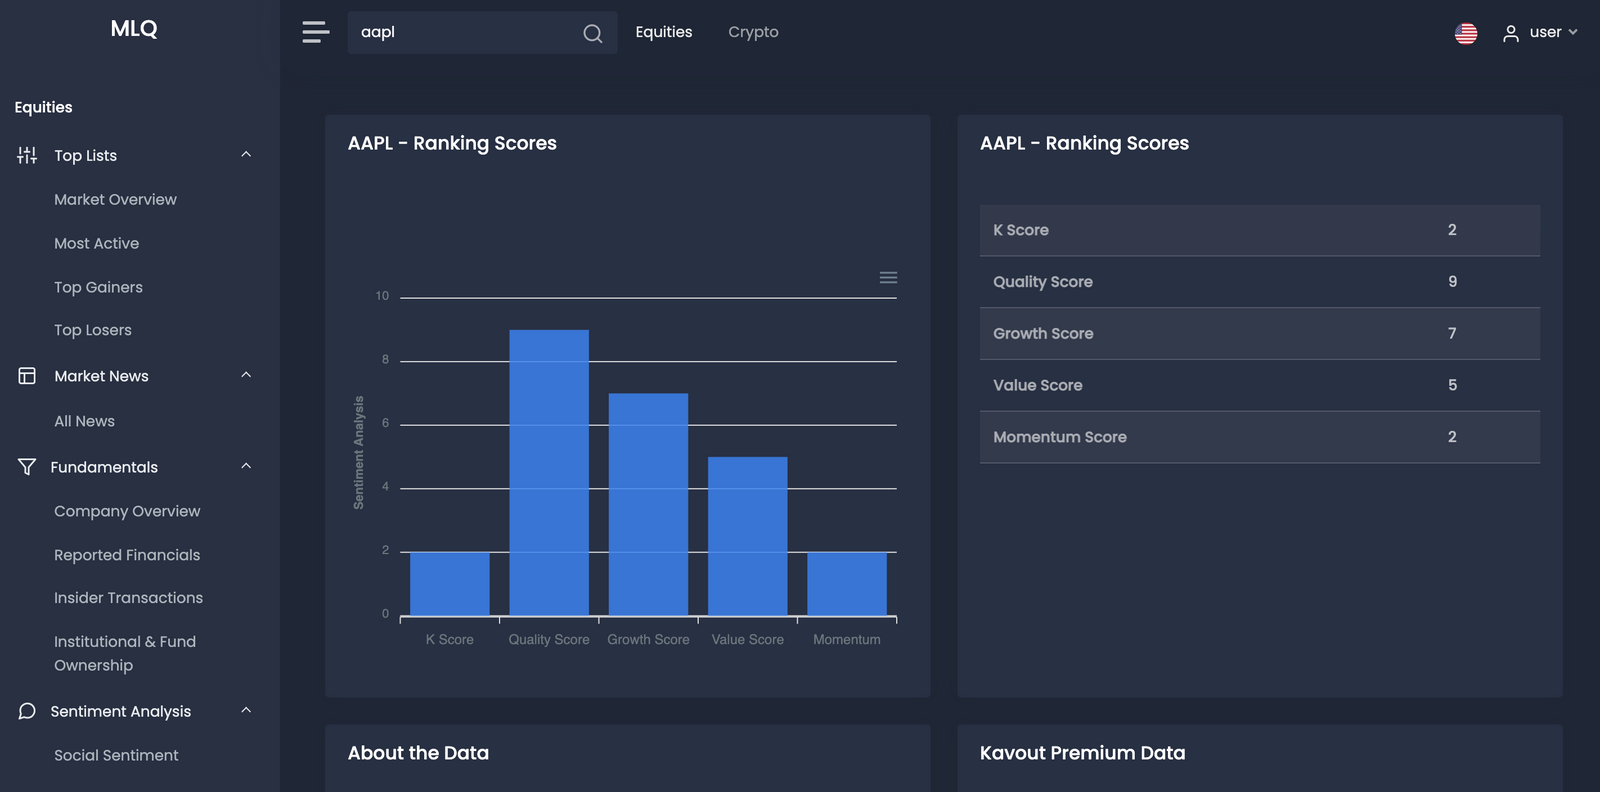
With these factors, the company uses use a combination of machine learning techniques, statistical analysis, and ranking algorithms to derive a simple equity ranking ranging from 1 to 9.
As you can see below, the ranking scores include:
- K Score
- Quality Score
- Growth Score
- Value Score
- Momentum Score
Machine Learning for Multiday Estimates
Similar to the predictive ranking scores above, another one of MLQ's data providers— Brain Company—generates multiday stock ranking scores for multiple time periods.
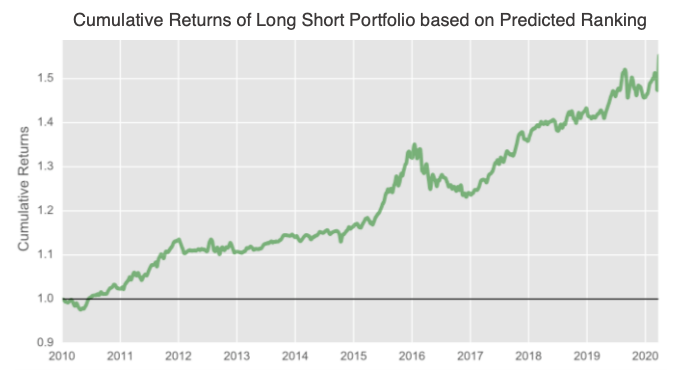
The stock score is referred to as the "ML Alpha Score", which is described as follows:
The ML Alpha Score is related to the confidence of a machine learning classifier in predicting top or bottom quintile returns for the next N trading days (e.g. next 21 days) for stock and ranges from -1 to +1.
In order to generate these rankings, the company uses machine learning to generate a daily stock ranking based on the predicted future returns of a universe of around 1,000 stocks over four time horizons: 2, 3, 5, 10, and 21 days.
Case Study: The Value of Alternative Data for Investors
In regards to the ML Alpha score mentioned above, below is a graph provided by a data provider that displays the cumulative return of a long-short portfolio that is rebalanced weekly based on the predicted ranking of future stock returns over the next 5 days.
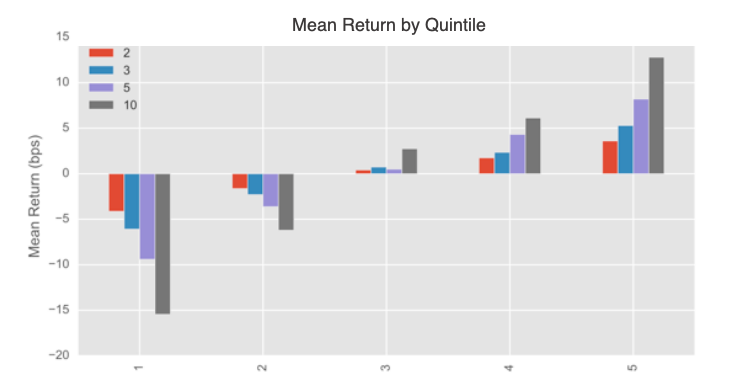
Returns Analysis by Prediction Quintiles
In addition, the company provides a graph below that shows the mean returns by quintile. In other words, this is the mean returns of investing in a basket of stocks as a function of the predicted ranking quintile on a 5 day time horizon.
It clearly appears that the highest predicted ranking quintile corresponds to the highest forward return, and vice versa the lowest prediction quintile corresponds to the most negative forward return following the characteristic “ladder shape”.
Finally, the graph below shows the cumulative return of 5 long-only portfolios that are made up of stocks divided into quintiles based on their estimated rankings and rebalanced every week:
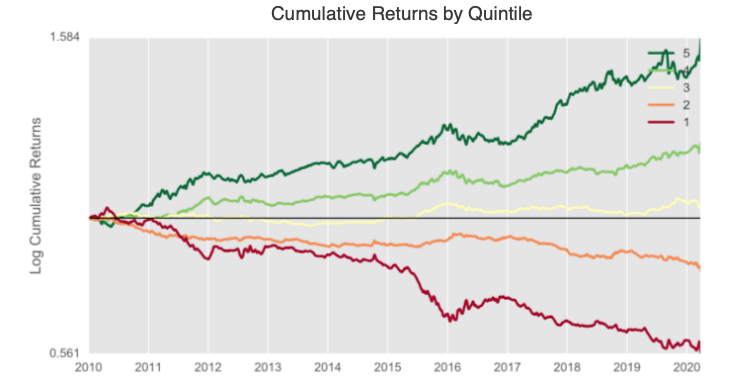
As you can see, the top-performing portfolio (dark green line) contains a portfolio made up of the highest predicted quintile returns and provides a higher cumulative return than a portfolio composed of the most negative stocks (dark red line).
Summary: The Rise of Alternative Data in Finance
In summary, alternative data refers to non-traditional data that is used to gain unique investment insights and uncorrelated alpha. Examples of alternative data sources include web scraping, mobile device data, IoT data, social sentiment, and more.
In order to make sense of all this data, machine learning can be applied to extract insights from text data, assign ranking scores, and predict estimated future returns.
With the growing quantity of alternative data sets, most investors lack the technical resources to analyze and research the data. To solve this, we built the MLQ app to source alternative data and machine learning-based insights for professional investors.
You can learn more about the platform here or sign up for a free account here.


