

In our previous article on AutoGen, we discussed how the library provides a multi-agent conversation framework:
AutoGen offers conversable agents powered by LLM, tool or human, which can be used to perform tasks collectively via automated chat.
In essence, these AI agents converse in a group chat going back and forth with one another in order to accomplish the user's goal, either with human feedback or fully autonomously.
In this guide, let's expand on the getting started code and look at a few more use cases, specifically for visualization. To do so, we'll adapt this notebook provided by Micrsoft, which provides an example of a "Group Chat with Coder and Visualization Critic".
You can access the premium version of this tutorial with a video walkthrough below:
 Peter Foy
Step 0: Installs & imports
In this example we'll use Google Colab, so we'll first need to run !pip install pyautogen and then import autogen into our notebook.
Next, let's upload a file called OAI_CONFIG_LIST with the following information:
[
    {
        "model": "gpt-4",
        "api_key": "<your OpenAI API key>"
    }
]
Next, in our notebook we can define our configuration for AutoGen as follows:
# Define configurations for AutoGen
config_list_gpt4 = autogen.config_list_from_json(
    "OAI_CONFIG_LIST",
    filter_dict={
        "model": ["gpt-4"],
    },
)
This configuration list becomes the foundation upon which our agents are built, so if we wanted to use different models for various agents, we could define new configuration lists and call them later with llm_config.
Step 1: Define AI Agents for Data Visualization
Now, with the GPT-4 configuration in place, let's define our first AI agent for data visualization.
In the following code, we're defining three distinct agents, here's an overview of each:
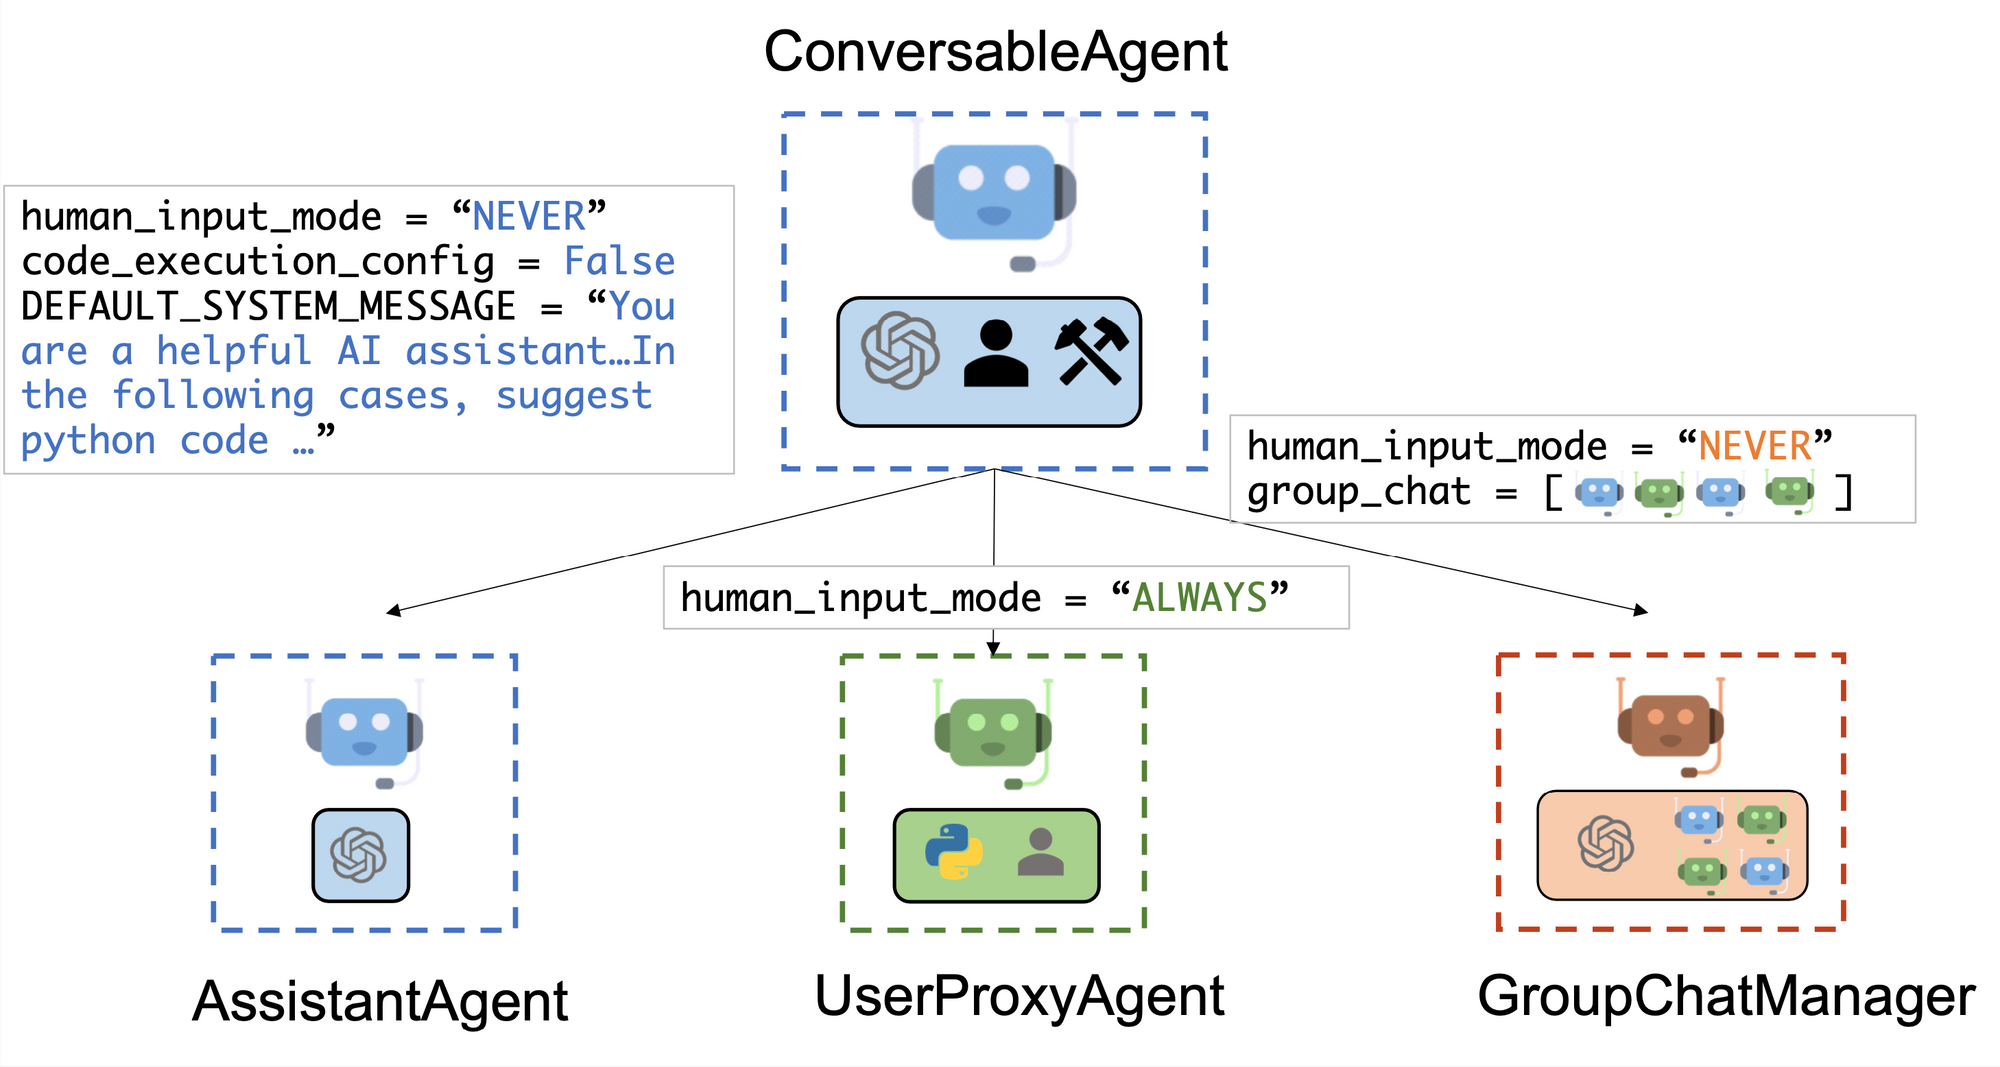
user_proxy
- As the AutoGen docs highlight, "the
UserProxyAgentis conceptually a proxy agent for humans, soliciting human input as the agent's reply at each interaction turn by default and also having the capability to execute code and call functions." - In this case, we're going to enable
human_input_mode=NEVERin order to see if the agents can accomplish the task autonomously, so theuser_proxywill just initiate the group chat.
coder
- The Coder is an
AsstantantAgentthat uses our GPT-4llm_configand as the demo notebook highlights, we don't need a custom system message for this as "the default assistant agent is capable of solving problems with code"
critic
- Finally, we have another
AsstantantAgentthat is designed to evaluate the quality of the coder's data visualization code. As you can see, we have a much more precise system message for this agent with the exact response formats, objective, and so on that we want. Here is the full system message, which is slightly adapted from the demo notebook:
Data Visualization Critic System Message
Critic. You are a helpful assistant highly skilled in evaluating the quality of a given financial visualization code by providing a score from 1 (bad) - 10 (good) while providing clear rationale. YOU MUST CONSIDER VISUALIZATION BEST PRACTICES for each evaluation. Specifically, you can carefully evaluate the code across the following dimensions:
- bugs (bugs): are there bugs, logic errors, syntax error or typos? Are there any reasons why the code may fail to compile? How should it be fixed? If ANY bug exists, the bug score MUST be less than 5.
- Data transformation (transformation): Is the financial data transformed appropriately for the visualization type? E.g., is the dataset appropriately filtered, aggregated, or grouped if needed? If a date field is used, is the date field first converted to a date object etc?
- Goal compliance (compliance): how well the code meets the specified visualization goals?
- Visualization type (type): CONSIDERING BEST PRACTICES, is the visualization type appropriate for the financial data and intent? Is there a visualization type that would be more effective in conveying insights? If a different visualization type is more appropriate, the score MUST BE LESS THAN 5.
- Data encoding (encoding): Is the financial data encoded appropriately for the visualization type?
- aesthetics (aesthetics): Are the aesthetics of the visualization appropriate for the visualization type and the financial data?
YOU MUST PROVIDE A SCORE for each of the above dimensions.
{bugs: 0, transformation: 0, compliance: 0, type: 0, encoding: 0, aesthetics: 0}
Do not suggest code.
Finally, based on the critique above, suggest a concrete list of actions that the coder should take to improve the code.
GroupChatManager
- Finally, the Group Chat Manager defines our three agents:
[user_proxy, coder, critic]. As the docs highlight:
In the system, we register an auto-reply function in the group chat manager, which lets LLM decide who the next speaker will be in a group chat setting.
lm_config = {"config_list": config_list_gpt4, "seed": 42}

user_proxy = autogen.UserProxyAgent(
   name="User_proxy",
   system_message="A human admin.",
   code_execution_config={"last_n_messages": 3, "work_dir": "groupchat"},
   human_input_mode="NEVER",
)
coder = autogen.AssistantAgent(
    name="Coder",  # the default assistant agent is capable of solving problems with code
    llm_config=llm_config,
)
critic = autogen.AssistantAgent(
    name="Critic",
    system_message="""Critic. You are a helpful assistant highly skilled in evaluating the quality of a given financial visualization code by providing a score from 1 (bad) - 10 (good) while providing clear rationale...
{see full system message above}
""",
    llm_config=llm_config,
)

groupchat = autogen.GroupChat(agents=[user_proxy, coder, critic], messages=[], max_round=20)
manager = autogen.GroupChatManager(groupchat=groupchat, llm_config=llm_config)
Alright, with our three agent defined, let's start the group chat. First, I'll upload a simple CSV file to Colab of Tesla's daily share price, including Open, Low, High, Close, Volume.
Start the group chat
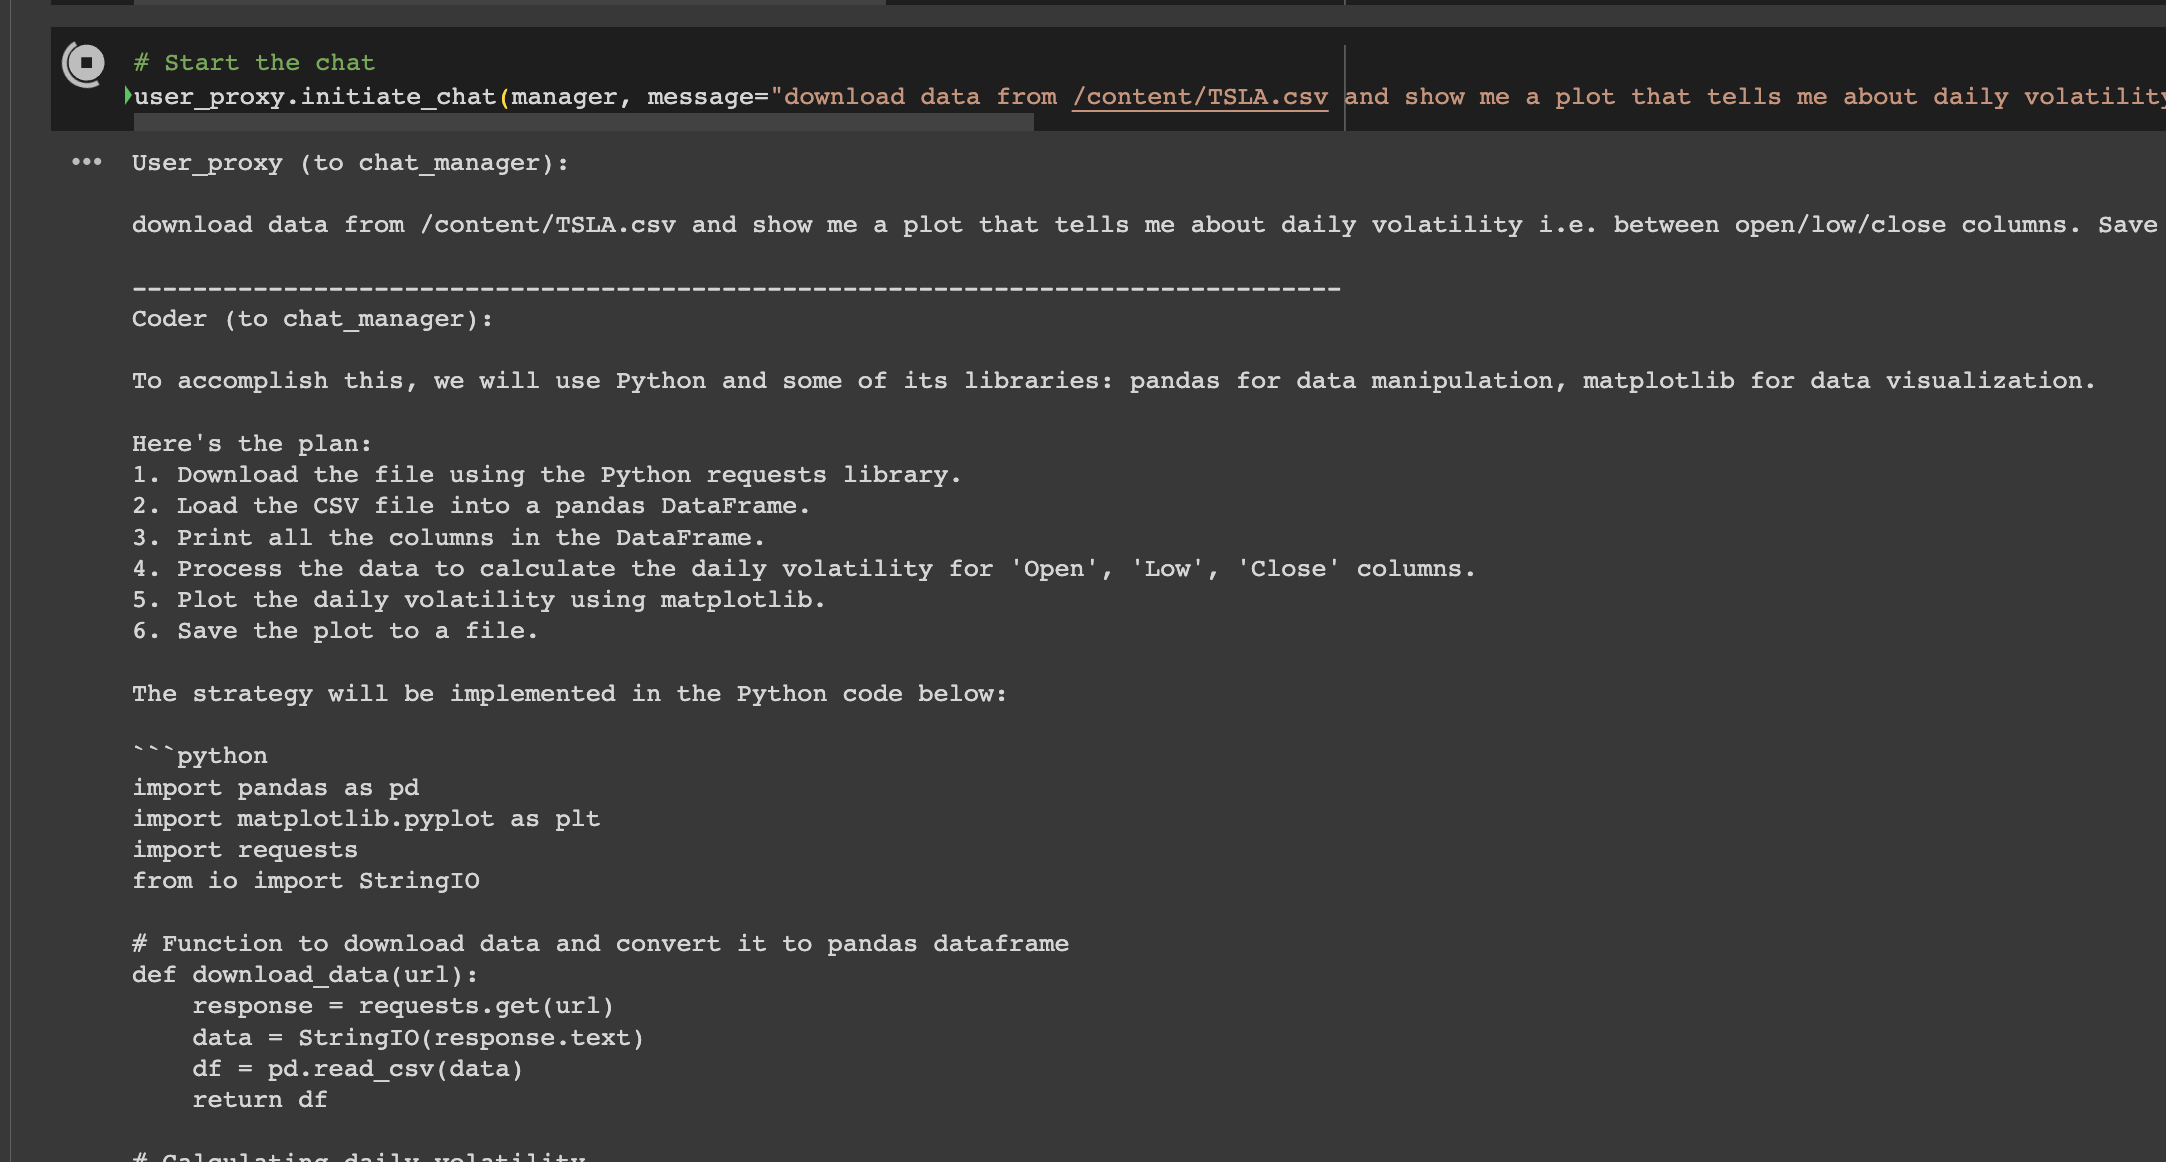
In the code below, user_proxy.initiate_chat(manager, message="...") is the method that starts the conversation within AutoGen.
- The
user_proxyagent, acting on behalf of the user, sends a message to themanager, which is theGroupChatManagerinstance handling the conversation. - The message contains the user's request, specifying a task related to downloading data, visualizing daily volatility from Tesla's stock data, and iterating on the code based on feedback from the
criticagent. - This is how the multi-agent system is prompted to start working on the task.
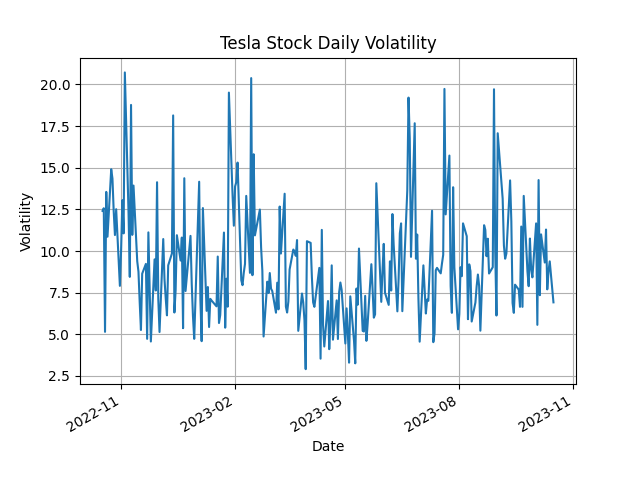
user_proxy.initiate_chat(manager, message="Download data from /content/TSLA.csv and show me a plot that tells me about daily volatility. Save the plot to a file. Print the fields in a dataset before visualizing it. Take the feedback from the critic to improve the code.")As we can see, the Coder agent starts off with a plan the the Group Chat Manager...looking good.
Next, the Critic provides feedback and suggestions to improve the code...nice.
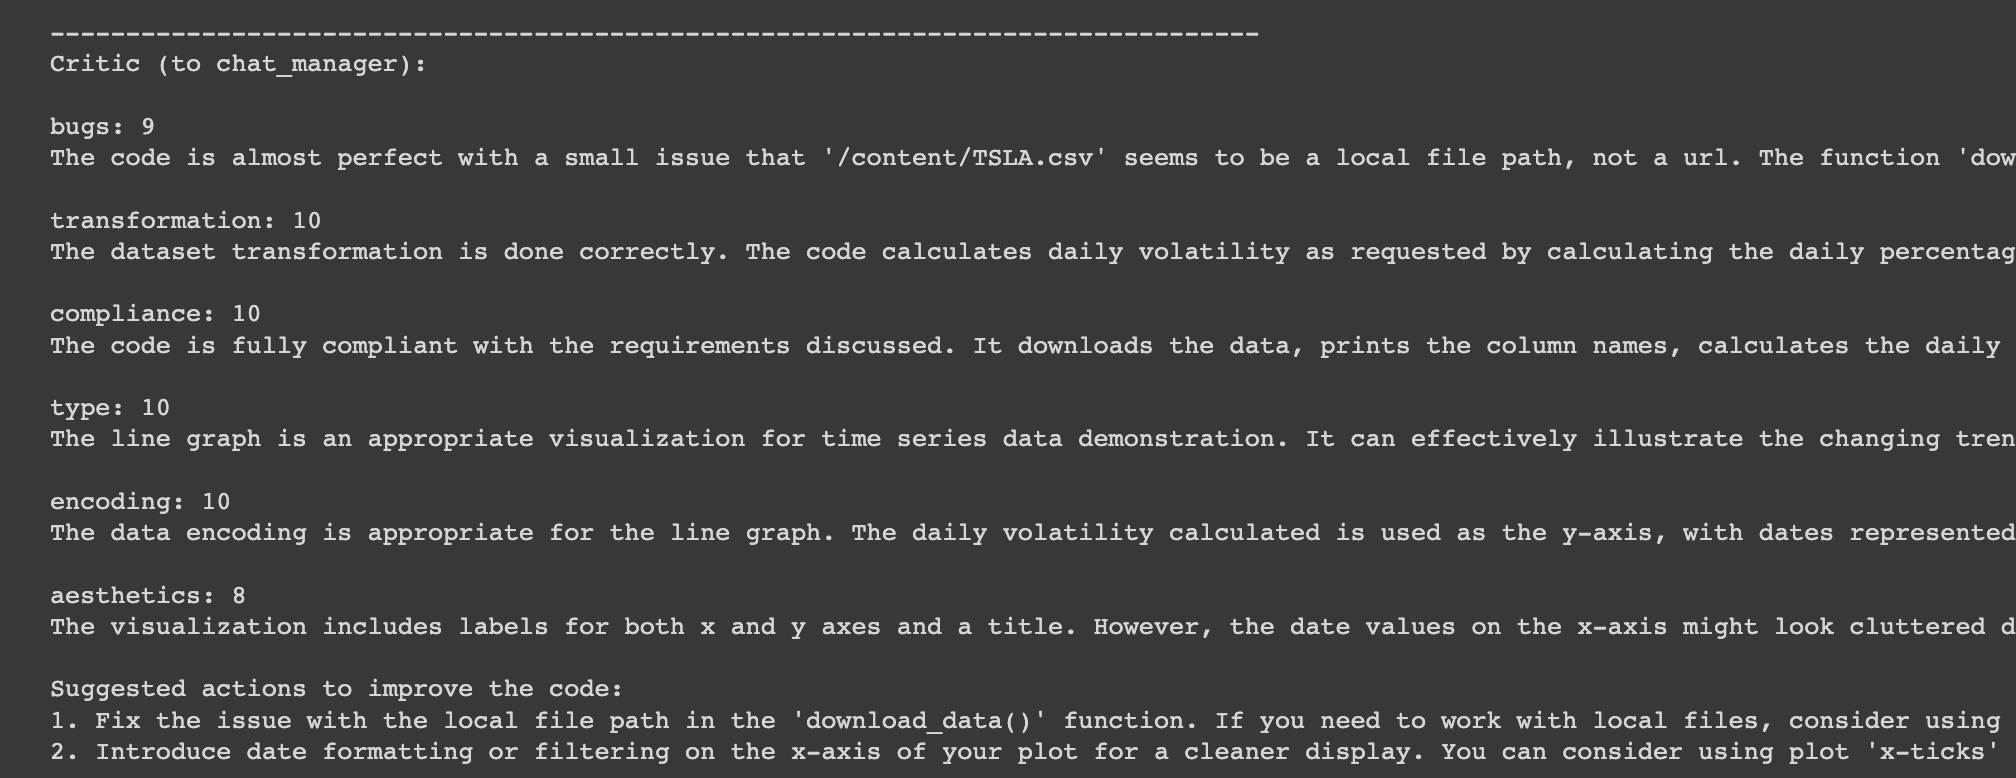
After a few more rounds of this we can see the Critic is satisfied with the code and the Group Chat is terminated.
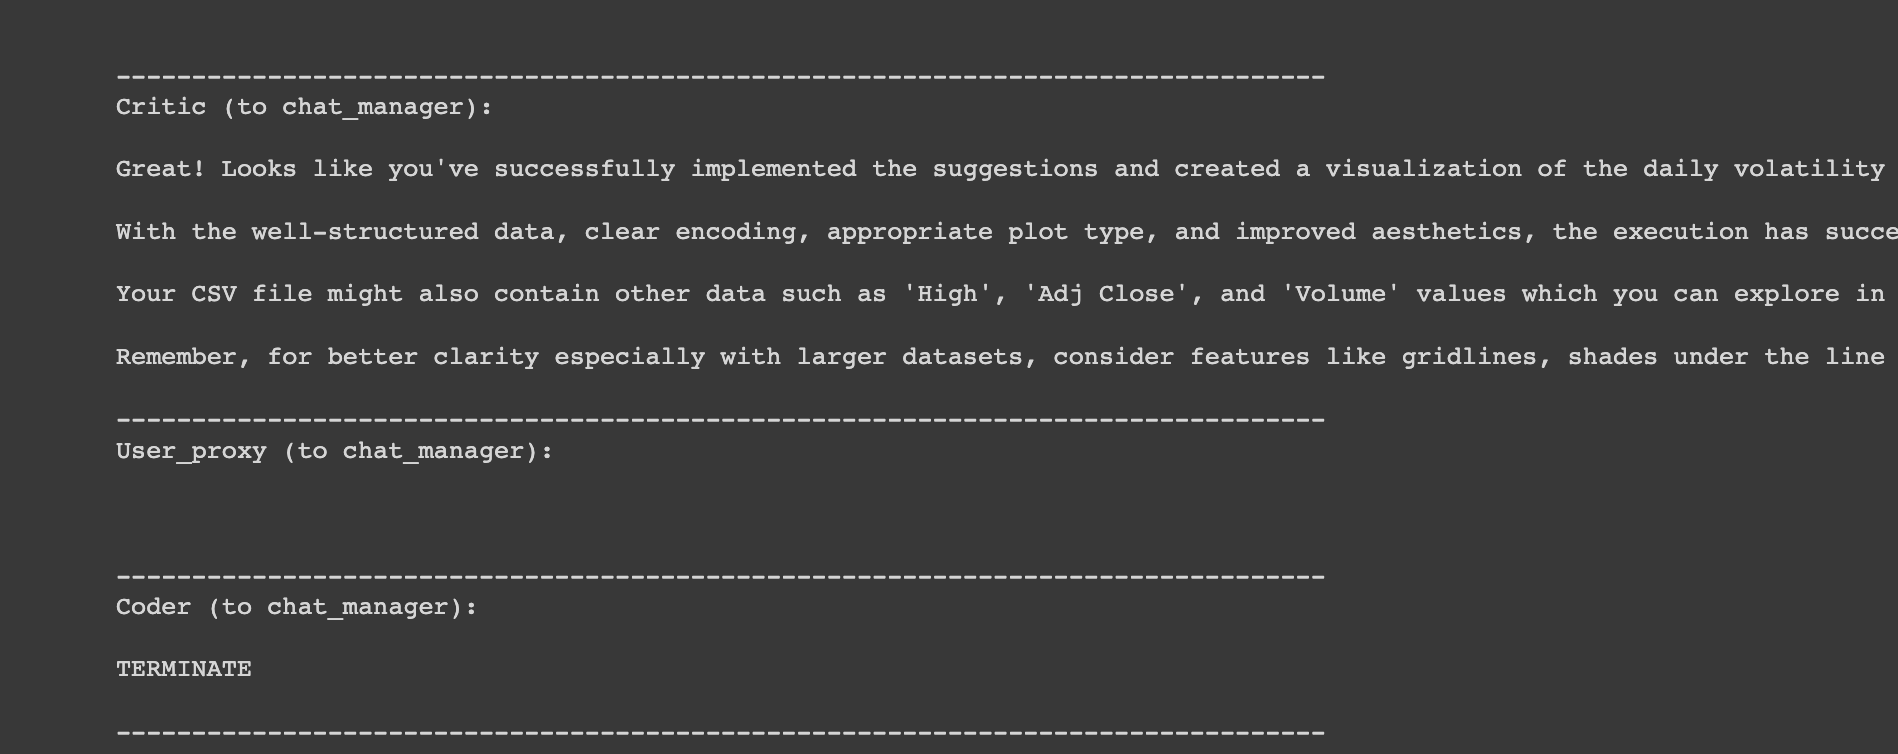
Next, we can check the groupchat folder, which we set as our work_dir for the results. As you can see, it's been quite a volatile year for Tesla...
More examples
Let's test out the data visualization agent with a few more examples:
Plot the short-term and long-term moving averages along with the closing prices to identify trends.
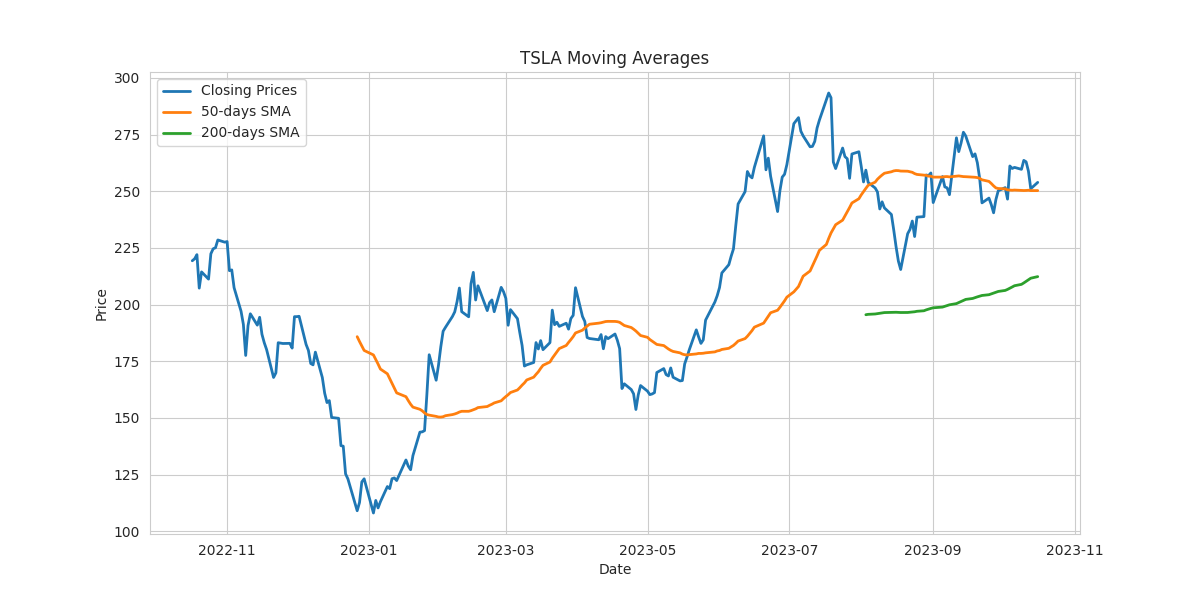
Not bad.
Plot Bollinger bands to visualize volatility and price levels over the time period.
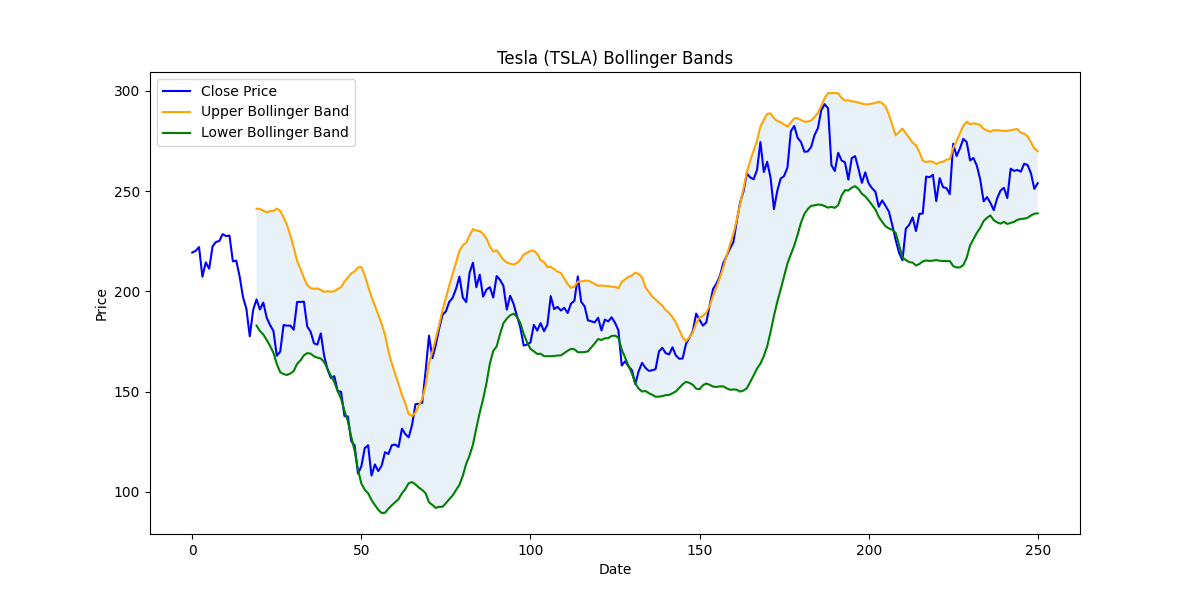
Neat.
Summary: Data Visualization with AutoGen
Just like other many other AI agents, AutoGen does make mistakes here and there, but the fact that it's able to debug it's errors, improve it's code, and produce these charts without any human input other than the initial prompt is quite remarkable.
In this data visualization example, we saw how by pairing a coder with a critic, the agents can accomplish tasks fully autonomously.
While this is certainly impressive, in the next few articles we'll look at how we can integrate third party tools and web search into the AutoGen framework.
Peter Foy


