

The fact that blockchain transaction data is completely publicly available makes it uniquely well suited for data science and machine learning.
In fact, cryptocurrency is the only asset class where all trading and investment activity can be extracted from the public ledger and analyzed, otherwise known as on-chain analysis.
Since blockchains offer such a wealth of open financial data, analysts can use this information to measure the transaction activity and utility of the network at a given point in time.
Through collecting and analyzing on-chain data, crypto traders and investors can gain insights into the overall sentiment and behavior of others in the network.
In this guide, we'll discuss exactly what on-chain analysis is and how you can use it to improve your crypto trading and investing. In particular, we'll review the on-chain analysis section and trading indicators provided in the MLQ App, including:
- What is On-Chain Analysis?
- 8 On-Chain Metrics: Token Summary
- Actionable On-Chain Trading Signals
Disclaimer: The views and opinions expressed by the author are for informational purposes only and do not constitute financial, investment, or other advice.
What is On-Chain Analysis?
On-chain analysis is an emerging field that involves examining the fundamentals, utility, and transaction activity of a cryptocurrency and its blockchain data.
On-chain analysts attempt to improve their understanding of a network in order to predict future price movements through analyzing a variety of metrics. As we'll discuss below, on-chain analysis involves gaining insights from the following types of blockchain data:
- Transaction volumes
- Block details such as miner rewards
- Price correlations
- Exchange inflows and outflows
- And more
For example, IvanOnTech Academy provides the following use case of on-chain analysis for Bitcoin:
Take Bitcoin for example. With on-chain analytics, one can examine user adoption and miner activity. With this, they can determine whether or not the market price is justified.
Similar to how fundamental analysis of equities aims to understand the true value of a company, on-chain analysis uses publicly available blockchain data to value a network.
Traders and investors also often pair on-chain analysis with technical analysis to determine suitable short-term entry and exit points for crypto assets.
In short, one of the most important use cases of on-chain analysis is using publicly available transaction and wallet data to understand the value of a blockchain network as opposed to speculative hype surrounding the crypto-asset.
Stay up to date with AI
8 On-Chain Metrics: Token Summary
Now that we've discussed what on-chain analysis is, let's look at the 8 on-chain metrics provided in the Token Summary section of the MLQ App. This data is provided by IntoTheBlock, which describes itself as:
A data science company applying cutting-edge research in AI to deliver actionable intelligence for the crypto market.
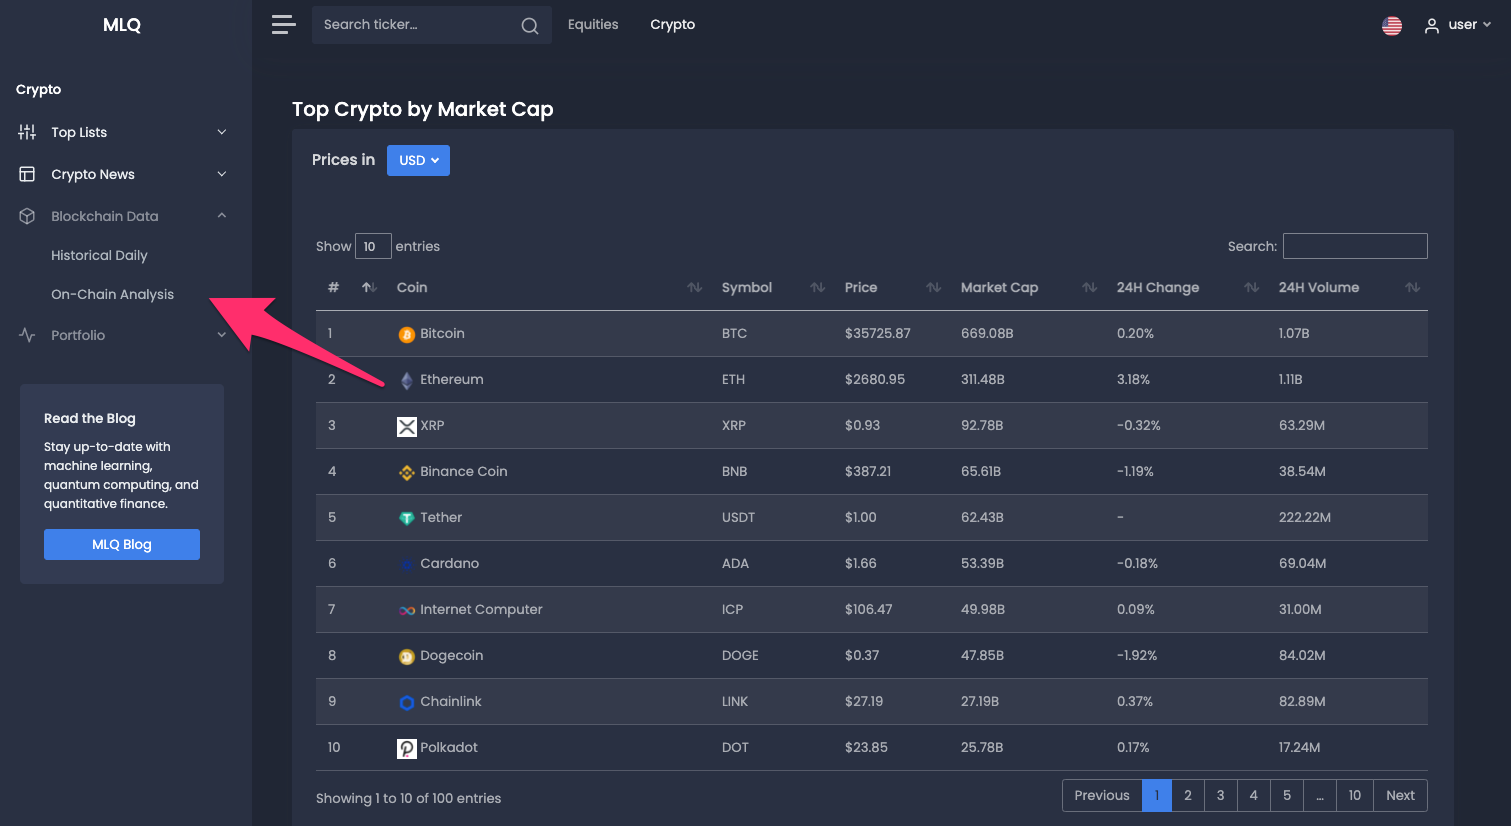
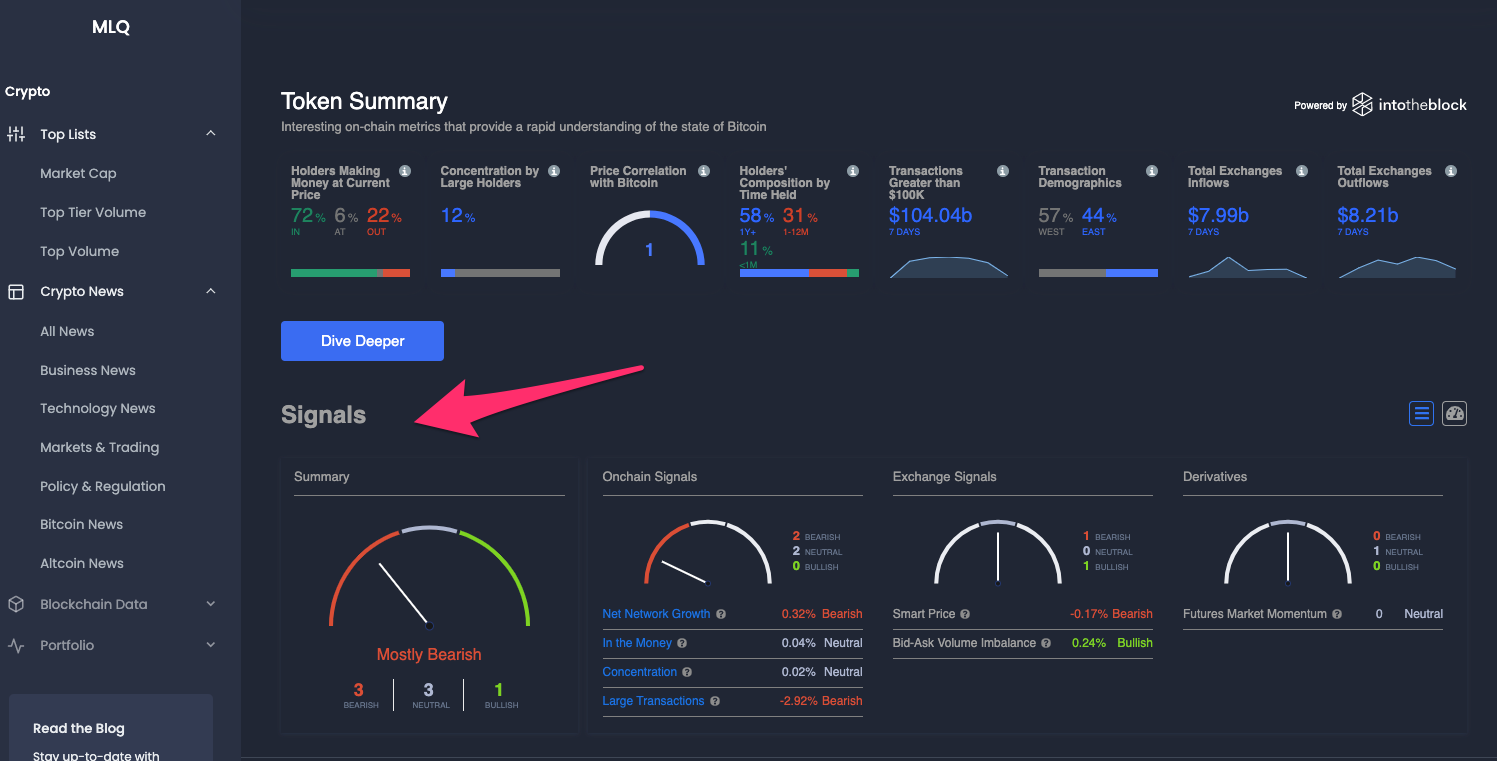
First, the token summary section provides an overview of some of the most relevant metrics for each crypto-asset, for example below is the summary of BTC:
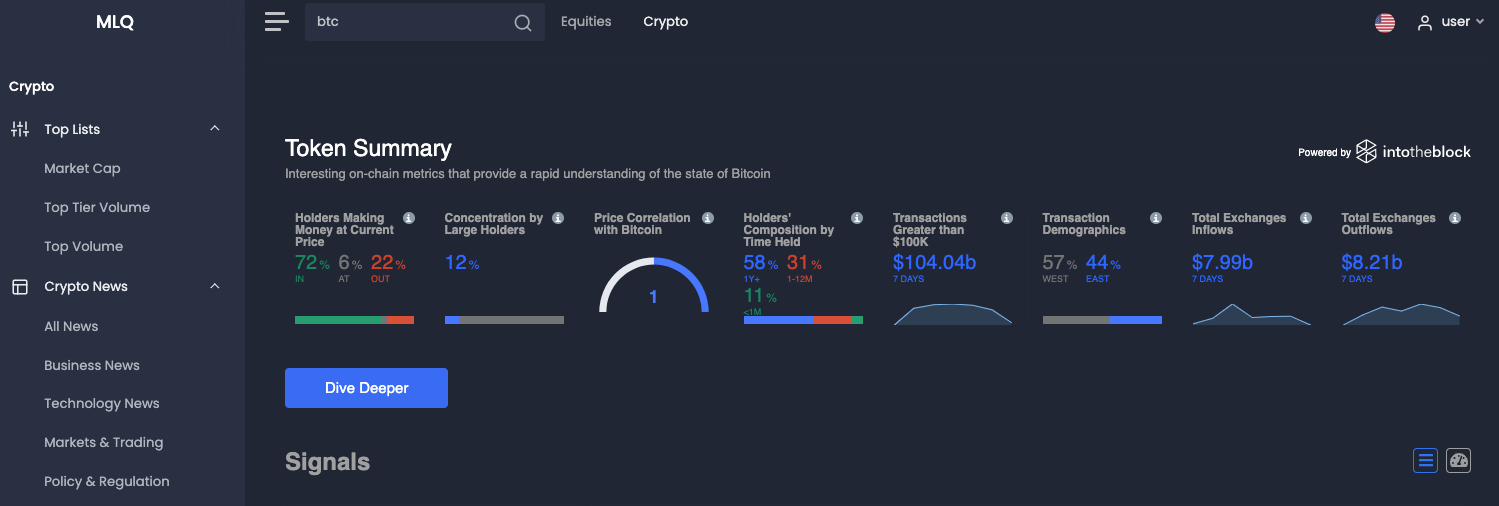
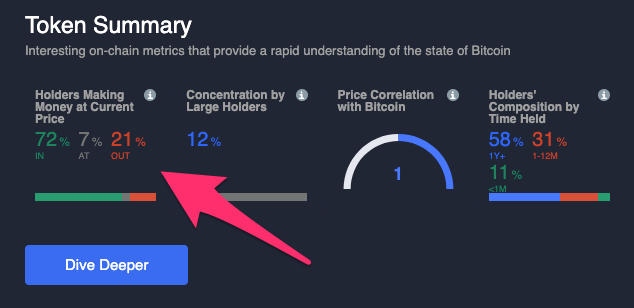
Holders Making Money at Current Price
The first metric identifies the average cost at which addresses with a balance were purchased at and compared to the current price. If the current price is higher than the average cost, the address is said to be "In the Money". If the current price is below the average cost, the address is said to be "Out of the Money".
As you can see below, this data is then averaged into the percentage of holders in, at, and out of the money at the current price:
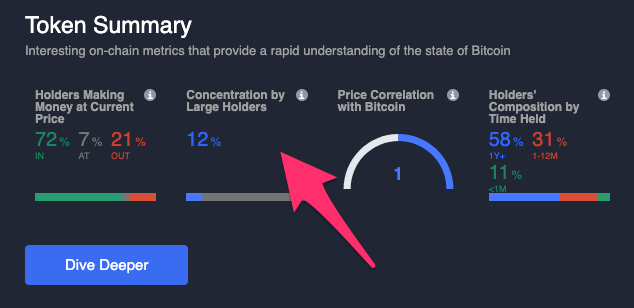
Concentration by Large Holders
This on-chain metric aggregates the concentration of "whales" and large investors. In other words, it indicates the percentage of circulating supply held by addresses holding over 1% of the total supply and large investors, or those holding between 0.1%-1% of supply.
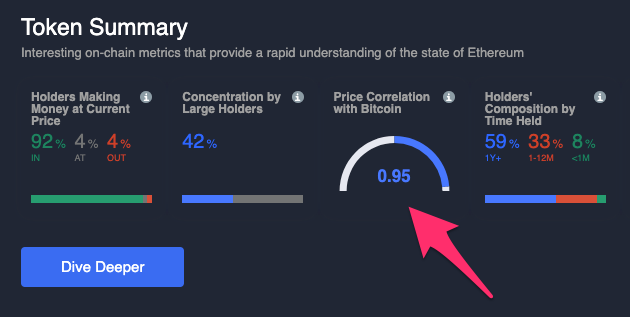
Price Correlation with Bitcoin
This metric provides the 30-day statistical correlation between a crypto asset and Bitcoin. For example, below we can see the price correlation of Ethereum to Bitcoin is 95% at the time of writing:
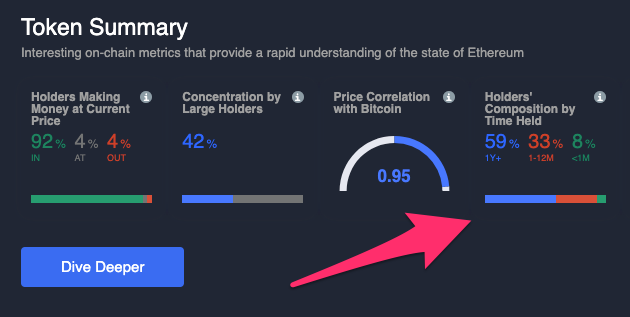
Holders’ Composition by Time Held
This on-chain metric provides an assets ownership distribution by time held. In other words, each address holding the asset is broken into 3 time periods:
- 1+ year: classified as a Hodler
- 1-12 months: classified as a Cruiser
- >1 month: classified as a Trader
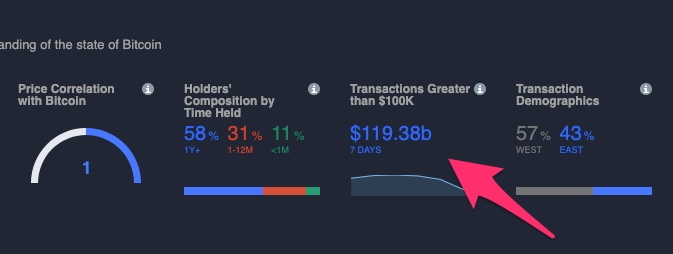
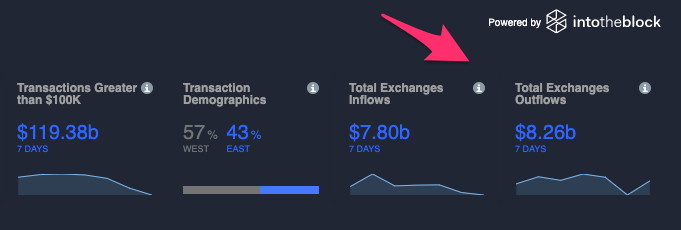
Transactions Greater than $100k
This metric shows the total volume of transactions greater than $100,000 USD over the last 7 days. As you can see below, there were 119.36 billion of transactions greater than 100k occurred in the last 7 days on the Bitcoin network:
Transaction Demographics
Transaction demographics refers to the number of transactions that took place during Western trading timezones (10am to 10pm UTC) compared to transactions that occur during the Eastern timezone (10pm to 10am UTC) for the previous 14 days:
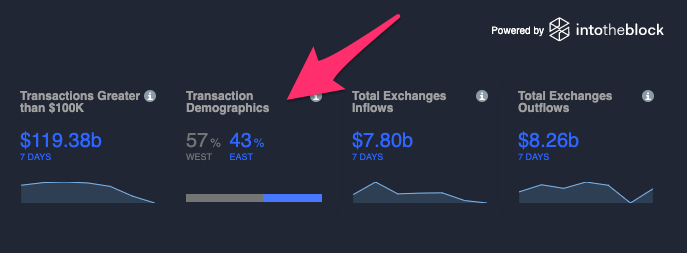
Total Exchange Inflows
Total exchange inflows refers to the total volume of a crypto-asset (in $ or tokens) that is deposited into the top centralized exchanges over the last 7 days.
Total Exchange Outflows
Total exchange outflows is the total amount of a crypto-asset (in $ or tokens) that is withdrawn from the top centralized exchanges over the last 7 days.
Actionable On-Chain Trading Signals
Now that we've looked at the 8 metrics provided in the Token Summary section, let's look at the actionable trading signals section below that.
These trading signals are based on machine learning models that are designed to gauge both sentiment and predict future price movements.
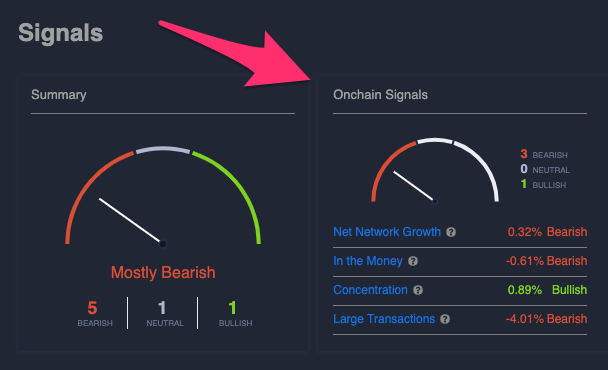
Each of the models is presented as a signal that is split into three main categories alongside an overall summary:
- On-chain
- Exchange
- Derivatives
Each of these signals are based on the underlying indicators provided by IntoTheBlock, although the trading signals represent momentum signals based on relative changes of the indicator.
The models analyze changes in these indicators and compare them to their previous price impact. This is done using various techniques and time horizons depending on the trading signal and crypto-asset being analyzed.
All trading signals are tested using a rigorous process that ensures it is performing better than a baseline scenario. Each model is also trained and periodically re-optimized in order to maintain high-quality performance.
As IntoTheBlock writes:
All models are trained and adjusted for every crypto-asset supported. Therefore, the thresholds for what is considered bullish, neutral and bearish vary by model and crypto-asset.
On-Chain Signals
On-chain signals are derived using blockchain indictors combined with single-variate models that each use slightly different methods to ensure consistency and accuracy. Each on-chain signal is recalculated once a day with the goal of projecting potential changes in next day's price action.
The on-chain signals in the MLQ app include:
- New Network Growth: This measures the change in total addresses for the crypto-asset in question. The signal tracks variation relative to the prior week's total addresses and is then optimized to reflect bullish or bearish sentiment for each individual asset's behavior.
- In the Money: This signal uses the In/Out of the Money indicator and then estimates the volume of tokens that are profiting from the asset at the current price level. This uses the 7-day moving average in the total volume of supply in the money and compares it to the previous day's value.
- Concentration: This signal measures daily changes the position of whales, or addresses with over 1% of circulating supply and investors, or those with between 0.1% and 1% of supply. Typically, if whales and investors are adding to their position it is considered bullish, although the actual thresholds vary based on the crypto-asset.
- Large Transactions: This signal is based on IntoTheBlock’s large transactions metric and analyzes changes in the number of transactions greater than $100,000. This signal acts a proxy for high net-worth individuals and institutional trading activity.
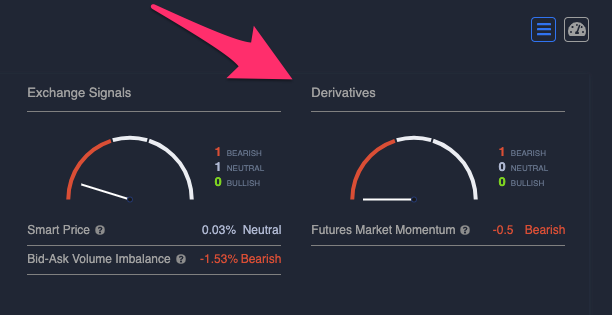
Exchange Signals
Unlike on-chain signals that are calculated daily, exchange signals are near real-time as they're recalculated every minute and have a time horizon of one minute. Based on research of high-frequency trading (HFT) strategies, these models have been tested and applied to each supported crypto-asset.
- Smart Price: This signal is a variation of the order book mid-price, in which bid/ask prices are weighted by their inverse volumes. Specifically, the Smart Price multiples bid price by volume on the ask and then sums this with ask price times bid volume, and divides this total by the aggregate bid-ask volume.
- Bid-Ask Volume Imbalance: This signal measures changes in the difference of the bid-price volume and the ask-price volume.
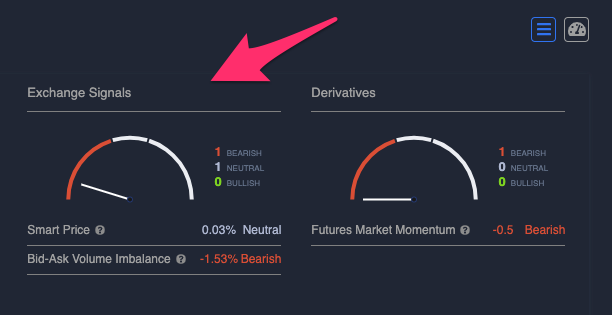
Derivatives
Finally, the derivatives signal is based on data from the futures market. The model is calculated on an hourly basis with the goal of projecting price movements over the next hourly period.
- Futures Market Momentum: This signal is calculated with a multi-variate model that analyzes changes in the volumes of futures contracts and open interest with respect to price changes. The signal is based on research from equities markets in which increases in volume and open interest are typically viewed as bullish for the current price trend. The signal analyzes all potential scenarios of the three variables and assigns specific thresholds for bullish/bearish sentiment of each supported crypto-asset.
Summary: On-Chain Analysis
Just like analyzing the fundamentals of a company, on-chain analysis involves analyzing publicly available blockchain data in order to get better insight into the value and utility of a network.
Instead of analyzing the balance sheet, cash flow, and income statement, on-chain analysis of digital assets involves extracting transaction, chain metrics, and wallet data for valuation purposes.
While still an emerging field of analytics, the sheer quantity of publicly available data available of crypto-assets makes it a particularly interesting application of data science and machine learning.
If you want to learn more about crypto on-chain analysis, you can create a free account for the MLQ app here or learn more about the platform here.


