

In this guide, we're going to review an interesting application of AI for trading and investing: machine learning for multiday stock rankings.
In particular, we'll look at data provided in the MLQ app by Brain Company, which describes itself as:
A research company that creates proprietary datasets and algorithms for investment strategies, combining experience in financial markets with strong competencies in statistics, machine learning, and natural language processing (NLP).
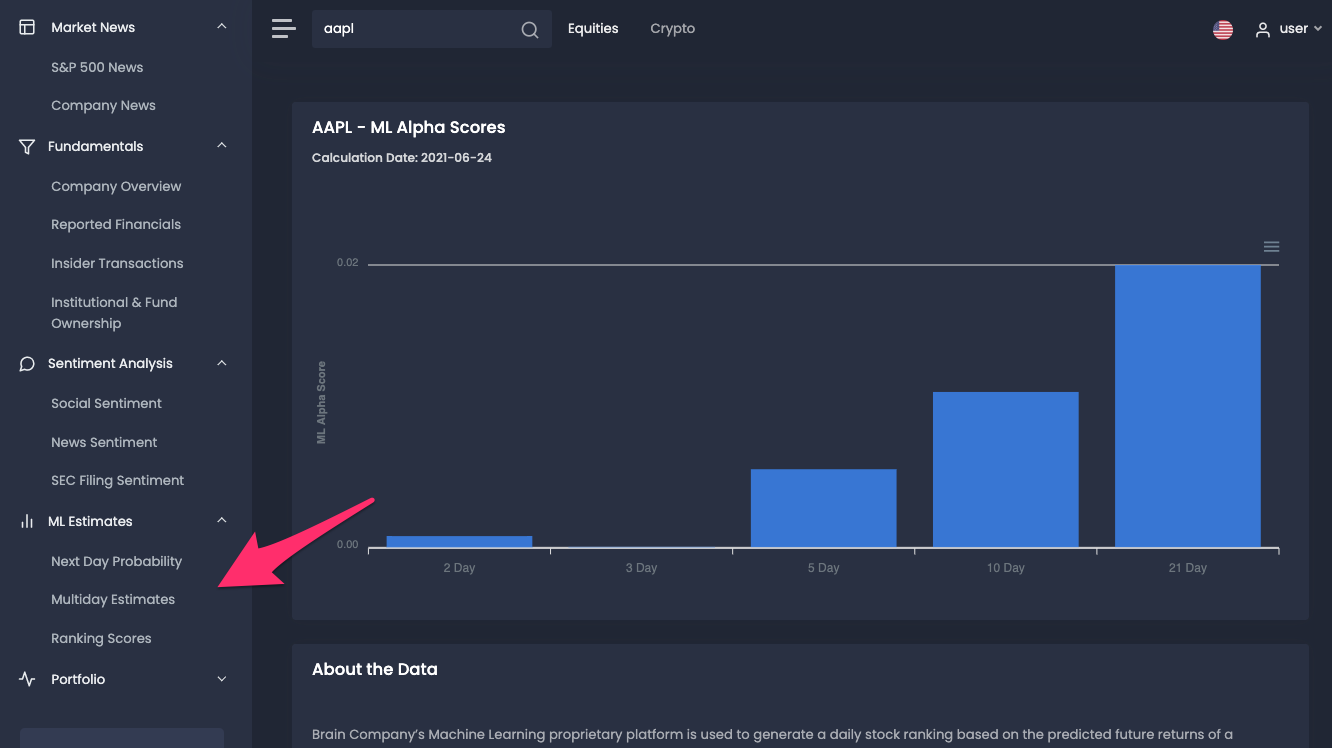
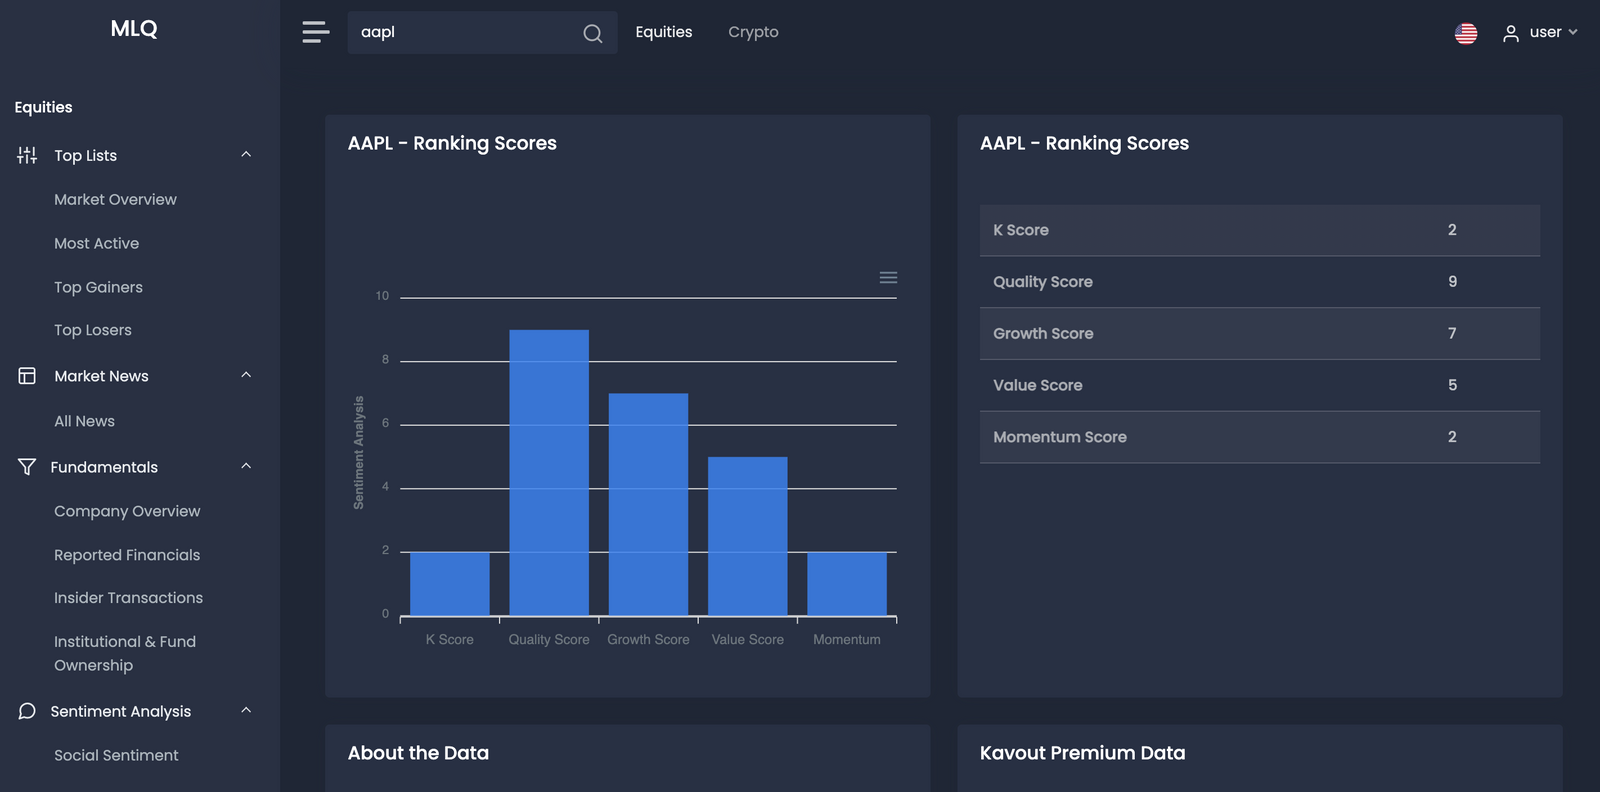
As you can see below, this data is provided in the "ML Estimates" section of the MLQ app:
Disclaimer: The views and opinions expressed in this article are for informational purposes only and do not constitute financial, investment, or other advice.
Machine Learning for Multiday Rankings
Before we get into how the data is generally, let's review what the multiday stock ranking scores actually mean.
In this case, the stock scoring is referred to as the "ML Alpha Score", which is described as follows:
The ML Alpha Score is related to the confidence of a machine learning classifier in predicting top or bottom quintile returns for the next N trading days (e.g. next 21 days) for stock and ranges from -1 to +1.
In order to produce this predictive equity ranking, Brain Company’s proprietary machine learning platform is used to generate a daily stock ranking based on the predicted future returns of a universe of around 1,000 stocks over four time horizons: 2, 3, 5, 10, and 21 days.
The model implements a voting scheme of machine learning classifiers that non-linearly combine a variety of features with a series of techniques aimed at mitigating the well-known overfitting problem for financial data with a low signal-to-noise ratio.
The calculation is done in the morning before the market open.
Stay up to date with AI
Unsupervised Machine Learning for Stock Rankings
In order to generate these predictive stock rankings, Brain Company uses a branch of machine learning called unsupervised learning.
Unlike supervised learning that uses labeled training data and is trying to map inputs to features, with unsupervised learning we're trying to learn the overall structure of the input data.
If you'd like to learn more about unsupervised learning for finance, check out our guide: Unsupervised Learning: Stock Market Clustering with K-Means.
In the context of unsupervised learning for multiday stock estimates, as described on their site:
Brain combines various clustering algorithms together with dimension reduction techniques to extract relevant features and to cluster various types of data sets, for example all company documents by topic or the past history of market days in order to extract meaningful information.
Model Inputs
In terms of model inputs, these are represented by stock-specific features such as price and volume-related metrics, including momentum and mean reversion over various time scales, fundamentals, and more. Specifically, they highlight several examples of features used in the model:
- Time-varying and stock-specific features like price and volume related metrics or fundamentals
- Time fixed stock-specific features like the sector and other database information
- Market regime features such as volatility and other financial stress indicators
- Calendar features representing possible anomalies, for example, the month of the year
ML Alpha Score
As mentioned, the ML Alpha score is a ranking score that highlights the machine learning classifiers confidence that a particular stock belongs to the bottom or top quintile returns for the next $N$ trading days (i.e. the next 21 days).
These scores rank from -1 to +1 where a negative score indicates the model is more confident that the stock belongs to the lower returns quintile. Conversely, a positive score means the system is more confident the stock belongs to the higher returns quintile.
How to Use the ML Alpha Score
In order to the ML Alpha score, it is important to note that the score has a meaning only if used to compare different stocks to perform a ranking.
A typical use case for the ML Alpha score is to collect the score for a small basket of stocks and order them based on the ML Alpha ranking score. With this, a strategy would be to simply go long the top $K$ stocks, or build a long-short strategy and go long the top $K$ stocks and short the bottom $K$ stocks.
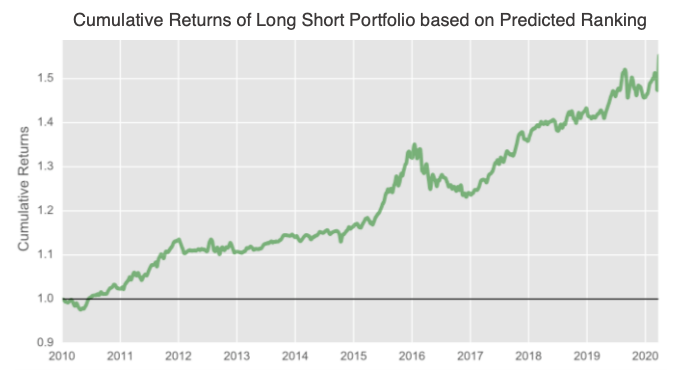
Prediction Weighted Long-Short Portfolio
Below is a graph provided by Brain Company that shows the cumulative return of a long-short portfolio with weekly rebalancing based on the out-of-sample predicted ranking related to the future stock returns for the next 5 days.
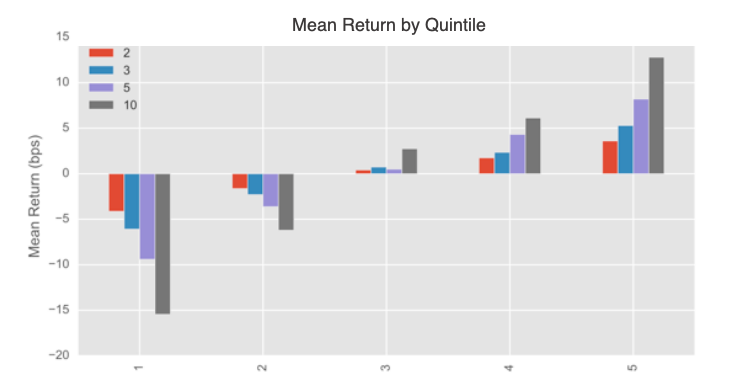
Returns Analysis by Prediction Quintiles
The following graph shows the mean returns by quintile. In other words, it is the returns of investing in a basket of stocks on different time horizons as a function of the predicted ranking quintile on a 5 day time horizon.
As Brain writes:
It clearly appears that the highest predicted ranking quintile corresponds to the highest forward return, and vice versa the lowest prediction quintile corresponds to the most negative forward return following the characteristic “ladder shape”.
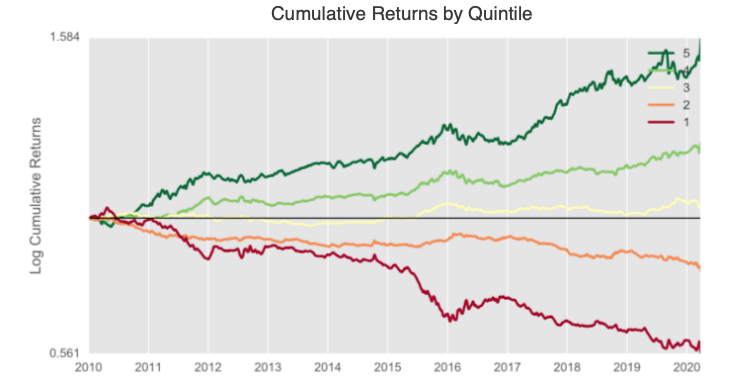
Finally, the following graph shows the cumulative return of 5 different long-only portfolios that are built with stocks diving into quintiles based on their predictive equity ranking and rebalanced every week:
As you can see, a portfolio that only contains stocks with the most positive prediction (dark green line) provides a much higher cumulative return than a portfolio composed of the most negative stocks (dark red line):
Summary: Machine Learning for Multiday Stock Rankings
As discussed, the MLQ app provides access to Brain's ML Alpha Score, which provides a multiday ranking score related to the confidence of the machine learning classifier in predicting whether the stock belongs to the top of bottom quintile returns for the next $N$ trading days.
In order to produce this predictive equity ranking, the company uses a branch of machine learning called unsupervised learning. Specifically, the model uses a voting scheme that non-linearly combines input features in order to mitigate the well-known overfitting problem in finance.
In addition to these multiday stock rankings, the MLQ app also provides predictive equity rankings from Kavout including:
- K Score
- Momentum
- Value
- Growth
- Quality
You can learn more about each of these ranking scores in our guide on How to Use AI and Machine Learning to Rank Stocks.
If you'd like to incorporate machine learning into your investment research process, you can get started with a free account to the MLQ app here.


